
Terrestrial Ecosystem Carbon Storage and Productivity Dynamics
Global Carbon Stocks and Ecological Distribution Dynamics. Terrestrial ecosystems act as a critical global sink, storing vast quantities of organic carbon across various biomes. According to the comprehensive biome synthesis conducted by Prentice et al. (2001), the total global carbon reserve stored within plant biomass is estimated to range between 466–654 Pg C (where 1 Pg = 10¹⁵ g). Forest biomes play a predominant role in this sequestration mechanism, containing approximately three-quarters of the global vegetative carbon pool, as detailed in Table 24.1.
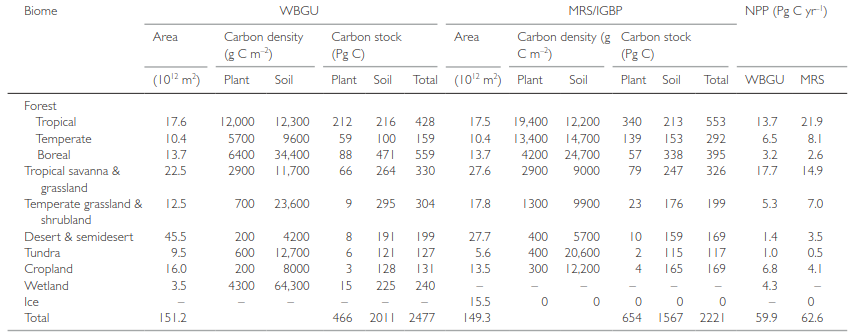
Table 24.1. Estimates of terrestrial carbon density, carbon stock, and net primary production (NPP) from two different datasets. Note: 1 Pg = 10¹⁵ g. Variations in biome classifications can lead to inconsistencies. In particular, the WBGU dataset includes ice with desert and semidesert. The MRS/IGBP dataset does not include wetlands. Source: From Prentice et al. (2001).
Among all terrestrial biomes, tropical forests represent the single largest carbon repository in living vegetation, whether measured by individual carbon density or total carbon stock. Total global net primary production (NPP) across all land ecosystems is estimated at approximately 60 Pg C yr⁻¹. Crucially, the combined physiological uptake of tropical forests, savannas, and grasslands accounts for more than half of the world's annual terrestrial carbon absorption.
Climatic Drivers and Physiological Regulators of Primary Production. Macroclimatic variables—specifically temperature, precipitation, and evapotranspiration—function as the primary drivers regulating net primary production at global scales, as illustrated in Fig. 24.4. Across diverse ecological gradients transitioning from frigid tundra environments to dense tropical rainforests, annual NPP scales upward alongside warmer climatic conditions. Extremely cold climates severely restrict plant production due to metabolic limitations and brief growing seasons.
Conversely, in extremely warm environments, excessive temperatures coupled with restricted water availability impose strict physiological limits on primary productivity. In arid climates, plant growth demonstrates a nearly linear response to increases in precipitation. These water-limited ecosystems exhibit high sensitivity in net primary production to interannual precipitation variability (Huxman et al. 2004).
Mathematical Functions Governing Net Primary Production Relationships
· Relationship (a): NPP = 3000 / (1 + e^(1.315 - 0.119T))
· Relationship (b): NPP = 3000 * (1 - e^(-0.000664P))
· Relationship (c): NPP = 10^(-1.66 + 1.66 * log₁₀ AET)
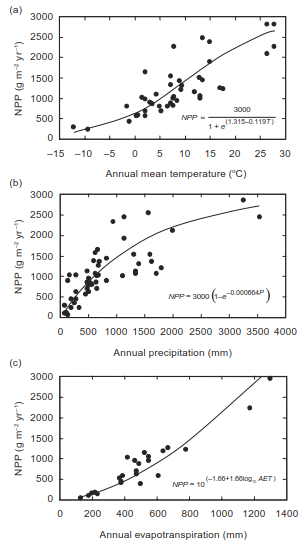
Fig. 24.4. Annual net primary production (above- and belowground) in relation to (a) annual mean temperature (Lieth 1975), (b) annual precipitation (Lieth 1975), and (c) annual evapotranspiration (Rosenzweig 1968). Del Grosso et al. (2008) provide updated relationships.
In humid climates where water supply is non-limiting, productivity eventually reaches a maximum plateau. Consequently, these moisture-saturated ecosystems exhibit minimal sensitivity in vegetative growth relative to interannual precipitation shifts. The integrated influence of thermal regimes and moisture availability on biomass accumulation is mirrored in empirical relationships with evapotranspiration. Ecosystems exhibiting low annual evapotranspiration sustain minimal productivity because temperatures are exceedingly low (e.g., Arctic tundra) or moisture is critically scarce (e.g., hyper-arid deserts). Comparable macroclimatic dependencies are observed in micro-meteorological flux networks measuring net ecosystem exchange (NEE) (Yi et al. 2010; Niu et al. 2012).
Remote Sensing Analysis and Global Vegetation Indexing. Satellite-based remote sensing of physiological canopy dynamics utilizes indices such as the normalized difference vegetation index (NDVI) to monitor terrestrial biomes globally, as shown in Fig. 24.5. The NDVI metric directly correlates with the canopy absorption of photosynthetically active radiation (PAR). When combined with production efficiency models, these satellite observations allow precise estimation of regional and global net primary production (Running et al. 2004; Zhao et al. 2005).
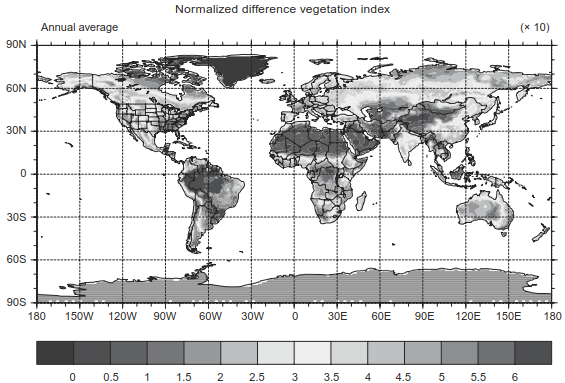
Fig. 24.5. Annual average normalized difference vegetation index for 1982–1993. High numbers indicate regions of high production. Low numbers indicate regions of low production. See color plate section.
A robust spatial correlation exists between global climatic conditions and satellite-derived NDVI values. Peak NDVI measurements are recorded across equatorial tropical rainforests in South America, Central Africa, and Southeast Asia. Elevated NDVI values also characterize tropical savannas in South America and Africa, temperate forests across eastern North America, the Pacific Northwest, continental Europe, eastern China, and eastern Australia. Conversely, high-latitude Arctic tundra and portions of the boreal forest display low NDVI values, while the lowest planetary NDVI readings coincide with hyper-arid desert biomes and sparse semiarid scrublands.
Spatial Distribution of Resource Limitations and Energy Fluxes. Global climate datasets enable the spatial mapping of specific environmental constraints that restrict net primary production, as modeled by Nemani et al. (2003) and depicted in Fig. 24.6. Water availability serves as the primary limiting factor for plant growth over approximately 40 percent of Earth's vegetated land surface. Temperature acts as the primary constraint across 33 percent of vegetated regions, while solar radiation limits primary production over the remaining 27 percent.
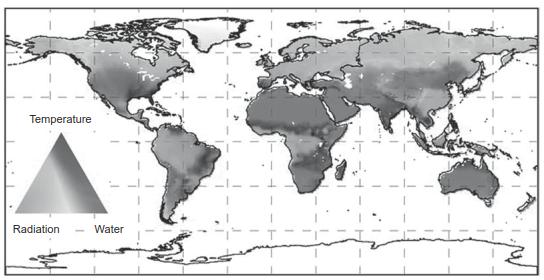
Fig. 24.6. Geographic distribution of climatic constraints to net primary production. Colors denote various limiting factors for water, radiation, temperature, and their interactions. Reproduced from Nemani et al. (2003) with permission of the American Association for the Advancement of Science. See color plate section.
Over broad geographic expanses, multiple environmental constraints co-occur simultaneously. For example, freezing winter conditions paired with persistent summer cloud cover severely restrict vegetative growth across high-latitude Eurasian regions, Canada, and Alaska. In western North America, severe cold winters combined with seasonal summer droughts constrain annual NPP. Moisture limitations are pervasive throughout the African continent and Australia. In contrast, in equatorial South America, Central Africa, and Indonesia, net primary production is restricted by dense cloud cover that reduces incident solar radiation, as well as seasonal moisture deficits in monsoon regions.
Empirical Carbon and Energy Flux Dynamics
- Annual Gross Primary Production (GPP): 119 ± 6 Pg C yr⁻¹ (consistent with 123 ± 8 Pg C yr⁻¹ for 1998–2005; Beer et al. 2010)
- Annual Ecosystem Respiration (Rₑ): 96 ± 6 Pg C yr⁻¹
- Annual Evapotranspiration (λE): 65 ± 3 × 10³ km³ yr⁻¹
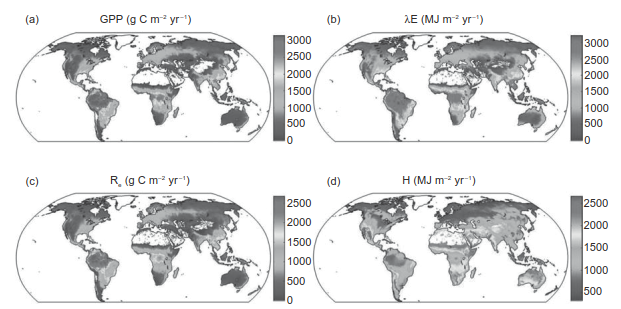
Fig. 24.7. Mean annual (a) gross primary production (GPP, g C m⁻² yr⁻¹), (b) latent heat flux (λE, MJ m⁻² yr⁻¹), (c) terrestrial ecosystem respiration (Rₑ, g C m⁻² yr⁻¹), and (d) sensible heat flux (H, MJ m⁻² yr⁻¹) for the period 1982–2008 empirically upscaled from FLUXNET eddy covariance flux towers. Reproduced from Jung et al. (2011). See color plate section.
As demonstrated by FLUXNET empirical syntheses (Jung et al. 2011; Fig. 24.7), terrestrial gross primary production, ecosystem respiration, and latent heat flux reach maximum values across equatorial and subtropical regions. Humid temperate regions in eastern North America, Western Europe, and Eastern China likewise exhibit high annual flux rates. In contrast, cold polar biomes and hyper-arid deserts exhibit the lowest overall flux magnitudes. Spatial patterns of gross primary production align closely with global precipitation contours (Beer et al. 2010). Sensible heat flux reaches its seasonal minimum in humid tropical zones and peaks across arid regions.
Structural Biomass Allocation and Canopy Architecture. Environmental gradients directly shape vegetation stature, structural architecture, and total biomass allocation, as shown in Fig. 24.8. Vegetative community structure transitions from short-stature grasses and low-lying shrubs to tall forest canopies as mean annual precipitation increases. Concurrently, plant communities shift from sparse canopies characterized by low leaf area index (LAI) values to dense, highly layered canopies displaying high LAI.
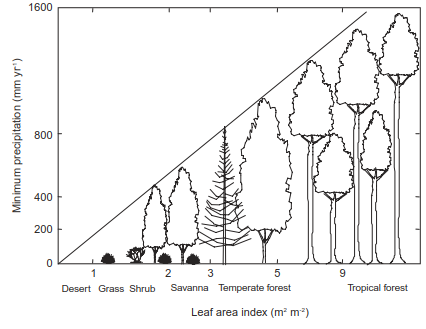
Fig. 24.8. Vegetation height and leaf area index in relation to the minimum annual precipitation needed to sustain the vegetation. Adapted from Woodward (1993).
These structural adaptations reflect a dynamic equilibrium between precipitation rates, soil moisture dynamics, and canopy leaf area (Grier and Running 1977; Woodward 1987, 1993; Nemani and Running 1989). Ecosystems maintain a theoretical maximum leaf area index where total canopy evapotranspiration balances local precipitation input.
Biomass Partitioning and Forest Structural Parameters
- Tropical Rainforest Biomass: Exceeds 30 kg m⁻² (>400 Mg ha⁻¹)
- Drier Tropical Forest Biomass: 5–10 kg m⁻² (50–100 Mg ha⁻¹)
- Canopy Height Range (Wet Tropics & Temperate Forests): 20–30 m or greater
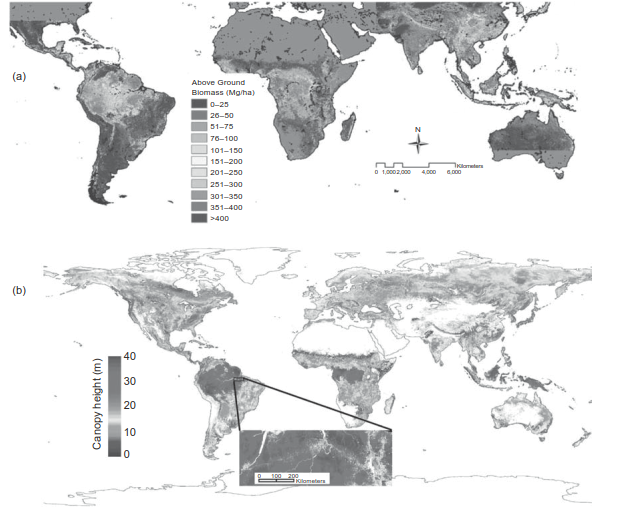
Fig. 24.9. Plant biomass and canopy height estimated from spaceborne light detection and ranging (Lidar) sensors. (a) Forest aboveground biomass in the tropics and subtropics. 10 Mg ha⁻¹ = 1 kg m⁻². Reproduced from Saatchi et al. (2011) with permission of the National Academy of Sciences. Thurner et al. (2014) provide a similar map for boreal and temperate forests. (b) Forest canopy height. Reproduced from Simard et al. (2011). Pan et al. (2013) review forest biomass and height. See color plate section.
Global measurements derived from spaceborne Lidar sensors confirm these macro-ecological distribution patterns (Saatchi et al. 2011; Simard et al. 2011; Pan et al. 2013; Thurner et al. 2014; Fig. 24.9). Aboveground forest biomass exceeds 30 kg m⁻² throughout the tropical rainforests of South America, Central Africa, and Southeast Asia, whereas drier tropical zones support significantly reduced biomass ranges of 5–10 kg m⁻². Average canopy height reaches 20–30 m or higher across wet tropical forests, as well as temperate forest regions of eastern North America, the Pacific Northwest, Europe, and Asia.
Belowground Biomass Partitioning and Root Depth Profiling. Biome-level patterns in root allocation demonstrate significant functional adaptations to ambient climate constraints (Canadell et al. 1996; Jackson et al. 1996, 2000; Poorter et al. 2012). Rooting depth systematically deepens in ecosystems characterized by elevated annual evapotranspiration, increased annual precipitation, and extended warm growing seasons (Schenk and Jackson 2002). Frigid biomes (such as Arctic tundra and boreal forests) display shallow root distributions, with 83–93 percent of total root biomass concentrated within the upper 30 cm of soil (Fig. 24.10).
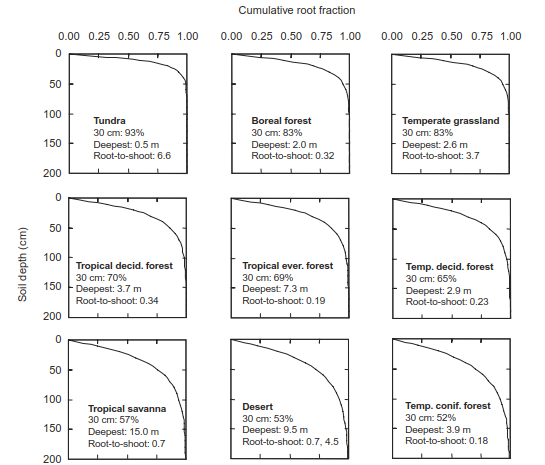
Fig. 24.10. Relative root abundance for tundra, boreal forest, temperate grassland, tropical deciduous forest, tropical evergreen forest, temperate deciduous forest, tropical savanna, desert, and temperate coniferous forest. Graphs show cumulative root distribution in relation to soil depth. Text boxes show the proportion of roots in the top 30 cm, average maximum rooting depth, and the average ratio of root-to-shoot biomass. Root-to-shoot ratios for desert are given separately for warm and cold deserts. Data from Jackson et al. (1996) and Canadell et al. (1996).
Root Distribution and Biomass Ratios Across Global Biomes
- Tundra: 93% in top 30 cm; Deepest: 0.5 m; Root-to-Shoot Ratio: 6.6
- Boreal Forest: 83% in top 30 cm; Deepest: 2.0 m; Root-to-Shoot Ratio: 0.32
- Temperate Grassland: 83% in top 30 cm; Deepest: 2.6 m; Root-to-Shoot Ratio: 3.7
- Tropical Deciduous Forest: 70% in top 30 cm; Deepest: 3.7 m; Root-to-Shoot Ratio: 0.34
- Tropical Evergreen Forest: 69% in top 30 cm; Deepest: 7.3 m; Root-to-Shoot Ratio: 0.19
- Temperate Deciduous Forest: 65% in top 30 cm; Deepest: 2.9 m; Root-to-Shoot Ratio: 0.23
- Tropical Savanna: 57% in top 30 cm; Deepest: 15.0 m; Root-to-Shoot Ratio: 0.7
- Desert: 53% in top 30 cm; Deepest: 9.5 m; Root-to-Shoot Ratio: 0.7 (warm desert), 4.5 (cold desert)
- Temperate Coniferous Forest: 52% in top 30 cm; Deepest: 3.9 m; Root-to-Shoot Ratio: 0.18
Functional Adaptations in Belowground Structure. Arctic tundra plants display shallow root architectures due to continuous permafrost layers and poorly drained soils that impede downward root extension. Plants adapted to these cold biomes maintain high root-to-shoot biomass ratios to maximize resource capture. Conversely, low root-to-shoot ratios occur in tall forest ecosystems due to extensive aboveground accumulation of woody stem biomass.
While the majority of total root mass remains within the upper 50–100 cm of the soil profile across most global biomes, specialized root systems penetrate significantly deeper into subsoil strata. In temperate and tropical trees, an average of 26 percent of root biomass resides within the top 10 cm, 60 percent within the top 30 cm, and 78 percent within the top 50 cm. Grasses display 44 percent of root biomass in the top 10 cm and 75 percent within the top 30 cm.
Global average maximum rooting depths reach 7.0 m for trees, 5.1 m for shrubs, and 2.6 m for herbaceous perennials (Canadell et al. 1996). Plant species native to arid and Mediterranean ecosystems develop the deepest overall root structures, reaching depths up to 9.5 m in deserts and 15.0 m in tropical savannas. Although these deep structural roots account for a minor fraction of total plant biomass, they perform crucial hydrological functions by tapping deep groundwater reserves and mitigating periods of severe, prolonged drought.
Date added: 2026-09-24; views: 1;