
Soil Carbon Pools, Ecosystem Dynamics, and Climate Change Response
Global Soil Carbon Storage and Spatial Distribution Pools. The total volume of carbon stored within terrestrial soil reservoirs represents one of the largest active organic carbon sinks on Earth, being comparable to or significantly exceeding the total carbon held within living plant biomass. Quantitative assessments demonstrate that global soils hold approximately 1500–2400 Pg C depending on the soil depth evaluated. Specifically, for the top layer of 0–100 cm depth, carbon estimates include 1395 Pg C (Post et al. 1982), 1462–1548 Pg C (Batjes 1996), 1502 Pg C (Jobbágy and Jackson 2000), and 1260 Pg C with an uncertainty range of 890–1660 Pg C (Todd-Brown et al. 2013). Extending the soil depth profile down to 0–200 cm yields estimates of 2376–2456 Pg C (Batjes 1996) and 1993 Pg C (Jobbágy and Jackson 2000), whereas evaluation down to 0–300 cm depth reveals a reservoir of approximately 2344 Pg C (Jobbágy and Jackson 2000). The vertical distribution profiles of organic carbon in forest and grassland ecosystems illustrate this progressive accumulation with depth. Geographically, cold or wet northern ecosystems, such as arctic tundra and boreal forest, account for a dominant proportion of global soil organic carbon stocks.
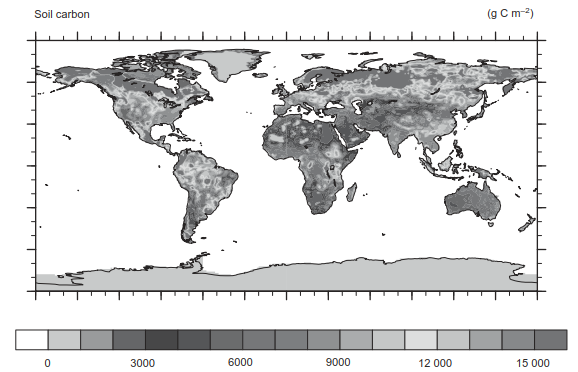
Soil carbon to a depth of 1 m from the Harmonized World Soil Database Fig. 24.11. Soil carbon to a depth of 1 m from the Harmonized World Soil Database. The original data have a spatial resolution of approximately 1 km and were re-gridded to a resolution of 1° in latitude and longitude. The global total for the re-gridded data is 1259 Pg C. Data from Wieder et al. (2013). The Northern Circumpolar Soil Carbon Database (Tarnocai et al. 2009; Hugelius et al. 2013) has data specific to the Arctic. See color plate section.
Ecosystem-Specific Soil Organic Carbon Holdings. Non-forested ecosystems like savannas and grasslands similarly maintain substantial reserves of soil organic carbon. Conversely, hyper-arid deserts exhibit the lowest soil carbon densities globally. Spatial mapping based on global databases, such as that depicted in Fig. 24.11, significantly underestimates total soil organic carbon because the northern circumpolar permafrost region alone stores an estimated 1672 Pg C. Within this permafrost domain, 496 Pg C resides in the 0–100 cm layer, 1024 Pg C is sequestered across the 0–300 cm interval, and an additional 648 Pg C is held in deeper cryogenic soil layers (Tarnocai et al. 2009).
Mechanisms of Litter Production and Net Primary Production. The net pool of soil organic carbon is determined by the equilibrium balance between annual organic litter inputs and turnover losses via microbially mediated decomposition. Plant litter production directly scales with net primary production across terrestrial biomes. Consequently, highly productive ecosystems input larger quantities of organic plant material into the soil annually compared to less productive systems. Across broadleaf, needleleaf, evergreen, and deciduous forest biomes spanning tropical to boreal regions, annual litterfall increases systematically under warmer and wetter climatic regimes as shown in Fig. 24.12. Tropical broadleaf forests exhibit high annual litterfall exceeding 900 g m⁻² yr⁻¹, whereas boreal needleleaf evergreen forests exhibit low annual litterfall below 300 g m⁻² yr⁻¹. Temperate forests display intermediate litter production values ranging between 300 and 650 g m⁻² yr⁻¹.
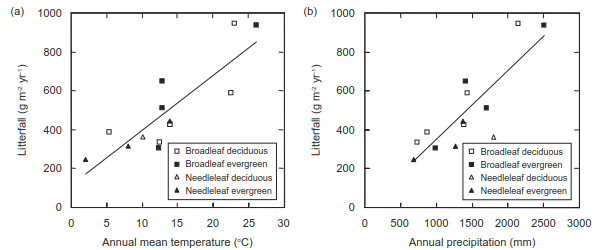
Relationship Between Litterfall and Climate Variables Fig. 24.12. Annual litterfall in forests in relation to (a) temperature and (b) precipitation. Data are means for 13 forest types. Data from Vogt et al. (1986). See also Matthews (1997).
Climatic Drivers and Biome-Level Decomposition Rates. Empirical field studies analyzing plant litter decomposition across diverse climatic conditions and vegetative communities establish that mass loss rates are fundamentally constrained by ambient temperature, precipitation, and actual evapotranspiration (Meentemeyer 1978; Gholz et al. 2000; Trofymow et al. 2002; Adair et al. 2008; Currie et al. 2010). A long-term multi-site experiment tracking pine needle decay across 26 distinct arctic, temperate, and tropical sites demonstrated that annual mass loss rates increase under warmer and wetter climatic regimes as documented in Fig. 24.13. Annual evapotranspiration served as the strongest single empirical predictor of decay kinetics. Plant litter incubated at tropical forest sites with high evapotranspiration lost approximately 40% of its initial mass over a one-year period. In contrast, litter placed in low evapotranspiration environments, such as cold tundra or hyper-arid deserts, experienced only about 10% mass loss over the same timeframe.
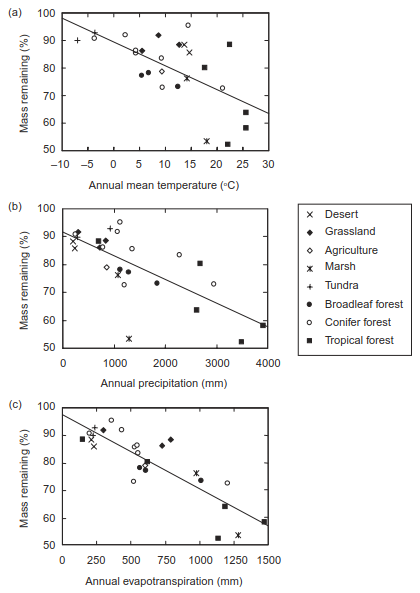
Decomposition Dynamics Across Environmental Gradients Fig. 24.13. Annual decomposition of pine litter in relation to (a) temperature, (b) precipitation, and (c) evapotranspiration. Symbols identify the 26 sites in which the litter was placed. Data from Gholz et al. (2000). Figure 21.5 shows multi-year results from the litter decomposition study.
Long-Term Biogeographical Shifts Driven by Climate Dynamics. Climate change occurring across centennial to millennial timescales fundamentally alters the spatial distribution, structure, and biogeochemical functioning of terrestrial vegetation. Among the longest cyclic drivers of climate variability is the recurring orbital waxing and waning of continental ice sheets. Approximately 18,000 years before present (18 kyr BP), during the Last Glacial Maximum, massive ice sheets covered large expanses of high-latitude landmasses across the Northern Hemisphere. Over the subsequent several thousand years, orbital forcing drove an increase in summer solar insolation in the Northern Hemisphere, which coincided with rising atmospheric CO₂ concentrations, global climate warming, and the progressive retreat of continental glaciers.
Post-Glacial Forest Reorganization and Fossil Pollen Records. Planetary warming prompted major geographical realignments of terrestrial plant communities, with cold-adapted taxa migrating poleward and being replaced by warm-adapted vegetation types. Sedimentary pollen sequences preserved in lakes and peat bogs provide a detailed paleoecological record of these historical succession patterns. For instance, the long-term pollen stratigraphy at Anderson Pond in Tennessee reveals the vegetation history over the past 16 kyr as illustrated in Fig. 24.14. Fossil pollen of Abies (fir), Picea (spruce), and Pinus (pine)—taxa representative of cold boreal forests—dominated the local landscape around 16 kyr BP. However, these late-glacial assemblages were not exact analogs of modern boreal ecosystems, as temperate hardwood species like Quercus (oak), Carya (hickory), Fraxinus (ash), and Ostrya/Carpinus (hornbeam) co-occurred in low abundances. Boreal taxa steadily declined as temperatures rose, giving way to temperate deciduous forest communities. Between 12.5 and 9.5 kyr BP, oak and associated mesophytic forest taxa established regional dominance, culminating around 8–6 kyr BP in modern-type hardwood forests dominated by oak, ash, and hickory.
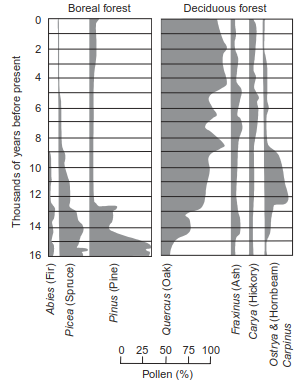
Late-Quaternary Pollen Stratigraphy at Anderson Pond Fig. 24.14. Pollen abundance at Anderson Pond, Tennessee, over the past 16 kyr BP. Adapted from Solomon et al. (1981).
Quaternary Vegetation Dynamics Across North America. Continental-scale pollen compilations confirm that similar macro-vegetational reorganizations occurred across eastern North America throughout the past 21 kyr, as reconstructed in Fig. 24.15 and Fig. 24.16. Populations of Picea and Pinus migrated systematically northward and westward to colonize newly deglaciated landscapes. Temperate deciduous trees, including Quercus and Fagus (beech), were restricted to southern refugia at 21 kyr BP but expanded rapidly in abundance and shifted their range boundaries northward in response to climate warming. Simultaneously, Tsuga (hemlock) expanded geographically from its glacial refugium centered in the southern Appalachian Mountains.
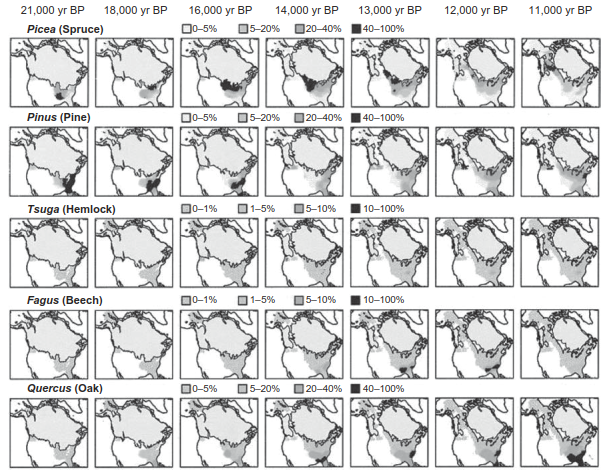
Continental Scale Migration Pathways (21 to 11 kyr BP) Fig. 24.15. Pollen abundance in boreal and eastern North America for spruce, pine, hemlock, beech, and oak trees between 21 kyr BP and 11 kyr BP. Adapted from Williams et al. (2004). See color plate section.
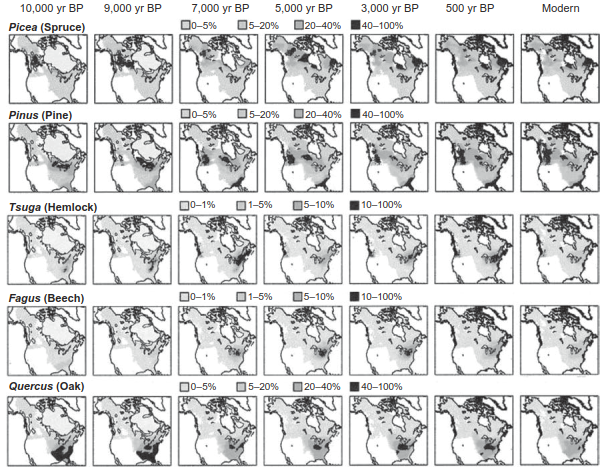
Continental Scale Migration Pathways (10 kyr BP to Present) Fig. 24.16. As in Figure 24.15, but for the period 10 kyr BP to present-day (modern). Adapted from Williams et al. (2004). See color plate section.
Novel Biomes and Transient Ecological Associations. Aggregating fossil pollen spectra into biome-level classifications demonstrates that during the glacial peak, a continuous belt of open spruce-dominated boreal forest and forest-tundra extended north of 35° N latitude. Unlike modern Canadian boreal forests, these late-glacial coniferous stands lacked significant representation of fir, birch, and alder, while high sedge pollen percentages indicate a much more open forest canopy structure. South of this belt, pine-dominated mixed forests prevailed, while temperate deciduous forests were confined to deep southern latitudes. By 12 kyr BP, spatial data coverage reveals a distinct latitudinal zonation east of the Appalachian Mountains, comprising spruce boreal forest in the far north, pine-dominated mixed forest, oak-dominated deciduous forest, and pine forests in Florida. However, a major emergent feature of this transitional period was the widespread presence of no-analog vegetation communities that lack modern biophysical equivalents (Williams et al. 2001). These historical assemblages consisted of open spruce woodlands with high herbaceous sedge cover co-occurring with temperate deciduous trees like ash and elm, illustrating that species respond individualistically to environmental changes to assemble novel biomes (Williams et al. 2007).
Holocene Climate Equilibrium and Environmental Reorganization. The poleward displacement of plant range limits constituted the dominant vegetation trend over the last 12,000 years. Migration velocities were relatively slow prior to 12 kyr BP, accelerated dramatically between 12 and 9 kyr BP, and subsequently slowed after 9 kyr BP. Ecosystems resembling modern vegetation formations did not coalesce until after 9 kyr BP. During this early Holocene transition, spruce boreal forests were less extensive than at present, arctic tundra was confined to narrow strips east of the melting ice sheet, and central North American deciduous forests formed prairie-aspen parklands in the west and mesophytic communities in the south. Southern pine species were mostly restricted to Florida until approximately 9 kyr BP, when southeastern pine forests expanded northward to establish their modern distributions. Modern-day biome patterns were fully established across the continent by 6 kyr BP.
Quantitative Paleoclimate Reconstruction and Orbital Forcing. Because plant species exhibit specific thermal and hydrological tolerances, calibrated pollen-climate transfer functions enable quantitative paleoclimate reconstructions. Inferred January and July temperatures show progressive warming across eastern North America during continental deglaciation, with the maximum rate of warming occurring between 12 and 9 kyr BP. Thermal conditions continued to warm until 6 kyr BP, after which summer July temperatures underwent high-latitude cooling while winter January temperatures continued to rise, particularly in the southeast. This trend reflects decreased seasonality following 9 kyr BP caused by variations in Earth's orbital parameters. At 21 kyr BP, North American precipitation exhibited a strict zonal gradient, with high annual rainfall in the south and dry conditions in the north. The modern east-to-west precipitation gradient developed around 9 kyr BP and intensified by 6 kyr BP, when interior continental regions reached their driest Holocene state.
The Mid-Holocene Thermal Maximum and African Monsoon Mechanics. The mid-Holocene period around 6 kyr BP represents a key paleoclimatic benchmark (TEMPO 1996; Prentice et al. 1996, 1998, 2000). During this epoch, enhanced axial tilt, greater orbital eccentricity, and a perihelion alignment in mid-September (compared to early January today) significantly elevated Northern Hemisphere summer solar insolation. Consequently, mid-to-high latitude climates were markedly warmer than present, allowing boreal forest ecosystems to extend northward beyond their current treeline limits in eastern Canada and northern Europe.
Holocene Green Sahara Dynamics and Monsoon Amplification. Increased summer solar insolation at 6 kyr BP substantially altered tropical climate dynamics, driving a warmer and wetter climate across North Africa. Stronger solar heating of the northern African continent intensified the thermal contrast between land and ocean. This led to a deep surface low-pressure system over the interior landmass, which strengthened the West African Summer Monsoon and pulled moist maritime air inland. Enhanced monsoonal rainfall transformed the region, enabling savanna grasses and shrubs to cover the area occupied by the modern Sahara Desert. Following 6 kyr BP, as summer solar insolation declined toward modern values, the continental landmass cooled, the summer monsoon weakened, and hyper-arid subtropical deserts expanded.
Vegetation Migration Lag and Climatic Disequilibrium. A critical determinant of terrestrial vegetation response to climate forcing is whether plant species distributions remain in equilibrium with rapid climate shifts. Under equilibrium conditions, shifts in climate parameters are matched synchronously by corresponding changes in geographical range limits. However, substantial migration lags occur when the rate of climate change exceeds the maximum intrinsic dispersal velocity of plant species, a vulnerability particularly pronounced in long-lived forest trees. Most tree species possess limited seed dispersal capabilities, resulting in maximum migration rates on the order of 100–1000 m yr⁻¹ or less (Davis 1981; Van Minnen et al. 2000; McLachlan et al. 2005). For example, Picea species required 3000 to 4000 years to migrate from their Appalachian glacial refugia to their current southern range boundaries. Similarly, Quercus species required approximately 8000 years to travel from southern glacial refugia to their modern northern range limits. These temporal lags demonstrate that tree distributions were in disequilibrium with climate during periods of rapid post-glacial warming, where migration rates were constrained by seed availability, dispersal vectors, and seedling establishment rates (Davis 1981; Davis et al. 1986; Ordonez and Williams 2013).
Photosynthetic Pathways and Atmospheric CO2 Modulation. Beyond direct climate forcing, historical fluctuations in atmospheric CO₂ concentration alter competitive plant interactions by shifting the relative physiological advantage between C₃ and C₄ photosynthetic pathways (Ehleringer et al. 1997; Collatz et al. 1998; Sage 2004; Beerling and Osborne 2006; Edwards et al. 2010; Monson and Collatz 2012). Due to fundamental biochemical differences in photorespiration, C₄ plants maintain a competitive metabolic advantage under elevated temperatures or depleted atmospheric CO₂ concentrations, whereas C₃ plants outperform C₄ species under lower temperatures or enriched atmospheric CO₂ environments.
- C₃ Photosynthetic Pathway: Demonstrates superior carbon-fixation efficiency under lower ambient temperatures or elevated atmospheric CO₂ levels due to reduced photorespiratory carbon losses.
- C₄ Photosynthetic Pathway: Possesses a competitive physiological advantage in high-temperature or low CO₂ environments by concentrating CO₂ internally to suppress photorespiration.
- Evolutionary Dominance: Macro-evolutionary expansion and ecological dominance of C₄-dominated grasslands occurred approximately 3–8 million years ago during the late Miocene.
- Disturbances and Fire Regimes: Tropical savannas represent highly fire-maintained biomes where recurring fire regimes are ecologically essential for preventing woody encroachment and maintaining C₄ grass dominance.
Date added: 2026-09-24; views: 1;