
Ocean Salinity, Density Structure, and Thermohaline Circulation
Evaporation and Precipitation Patterns 6.2. The salinity of mid-ocean surface water is controlled by the distribution of the world's evaporation and precipitation zones (see figs. 5.1 and 5.2). Salinity of ocean water is measured in grams of salt per kilogram of seawater and is expressed in parts per thousand (‰). The average ocean salinity is considered to be 35‰. In the tropics, precipitation is heavy on land and at sea; on land, the tropical rain forest is the result, at sea, the surface water has a low salinity, around 34.5‰.
At approximately 30°N and 30°S, the evaporation rates are high. These are the latitudes of the world's land deserts and of increased salinity in the surface waters, around 36.7‰. Farther north and south, from 50°N to 60°N and from 50°S to 60°S, precipitation is again heavy, producing cool but less salty surface water (around 34.0‰). These regions also correspond to the heavily forested areas of the Northern Hemisphere. At the polar latitudes, sea ice is formed in the winter. During the freezing process, the salinity of the water beneath the ice increases, and in the summer the thawing of the ice reduces the surface salinity once more. Climate zones will be discussed further in chapter 7.
Density Structure and Vertical Circulation 6.3. Temperature and salinity variations combine to control the density of ocean surface water. Many combinations of salinities and temperatures produce the same density; the result is shown in lines of constant density displayed in figure 6.8. This figure is related to the density values in table 4.4 of chapter 4.
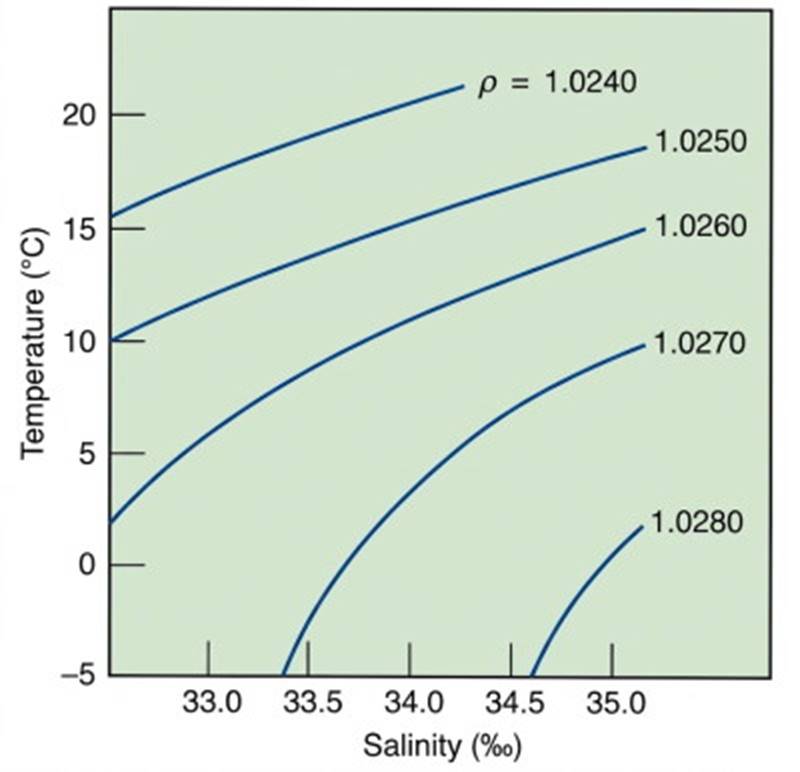
Fig. 6.8. The density of seawater, measured in grams per cubic centimeter, is abbreviated as ρ (rho) and varies with temperature and salinity. The pressure factor is not included. Many combinations of salinity and temperature produce the same density. Low densities are at the upper left and high densities are at the lower right.
As the salinity increases, the density increases; as the temperature increases, the density decreases. Salinity may be increased by evaporation or by the formation of sea ice; it may be decreased by precipitation, by the inflow of river water, by the melting of ice, or by a combination of those factors. Changes in pressure also affect density. As the pressure increases, the density increases. Because pressure plays a minor role in determining the density of surface water, its effects will be ignored in the following discussion.
Surface Processes. Less-dense water remains at the surface (for example, the warm, low-salinity surface water of the equatorial latitudes). Although the surface water at 30°N and 30°S latitudes is warm, it has a higher salinity than surface waters at the equator. Therefore, it is denser than the warm, low-salinity equatorial water. This 30° latitude surface water sinks below the equatorial surface water; it extends from the surface at 30°N to below the less-dense equatorial layer and back to the surface at 30°S.
The combined salinity and temperature in surface waters at 50°–60°N and 50°–60°S produces a water that is denser than either the equatorial or the 30° latitude surface water. The 50°–60° latitude water therefore sinks below the equatorial and 30° surface water and extends from the surface in one hemisphere below the other water types to the surface in the other hemisphere. Winter conditions in the polar regions lower the surface water temperature and, if sea ice forms, increase the surface salinity.
The result is a dense surface water that sinks at the polar latitudes. These variations in surface water properties and the resulting density changes produce a density-layered ocean. This layered system is shown in figure 6.9. The thickness and horizontal extent of each layer are related to the rate at which the water of each layer is formed and the size of the surface region over which it is formed.
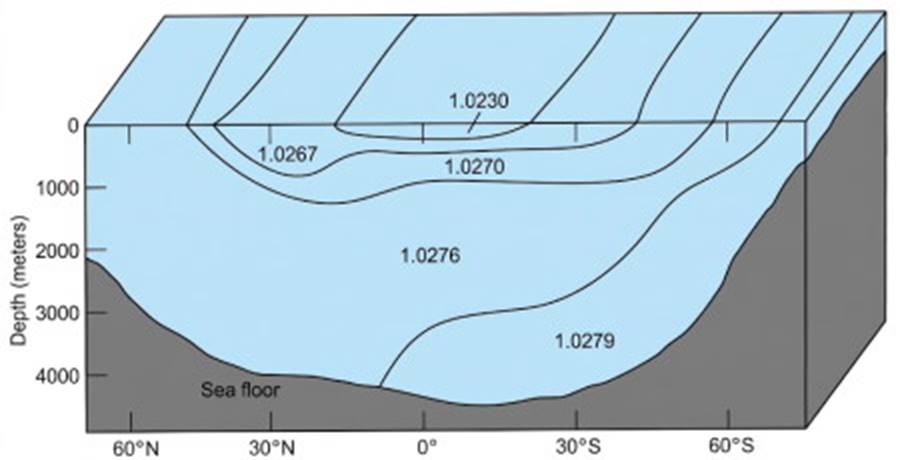
Fig. 6.9. Water of different densities forms a layered ocean. The density of each layer is determined at the surface by the climate at the latitude at which it is formed. Density values are given in grams per cubic centimeter.
Changes with Depth. The oceans have a well-mixed surface layer of approximately 100 m (330 ft) and layers of increasing density to a depth of about 1000 m (3300 ft). Below 1000 m the waters of the deep ocean are relatively homogeneous. A region between 100 m and about 1000 m, where density changes rapidly with depth, is known as a pycnocline (fig. 6.10).
Below the 100 m surface layer the temperature decreases rapidly with depth to the 1000 m level. A zone with a rapid change in temperature with depth is called a thermocline. Below the thermocline, the temperature is relatively uniform over depth, showing a small decrease to the ocean bottom.
A similar situation occurs with salinity. Below the surface water at the middle latitudes, the salinity increases rapidly to about 1000 m; this zone of relatively large change in salinity with depth is called the halocline. Beneath the halocline, relatively uniform conditions extend to the ocean bottom. Both a thermocline and a halocline are shown in figure 6.11.
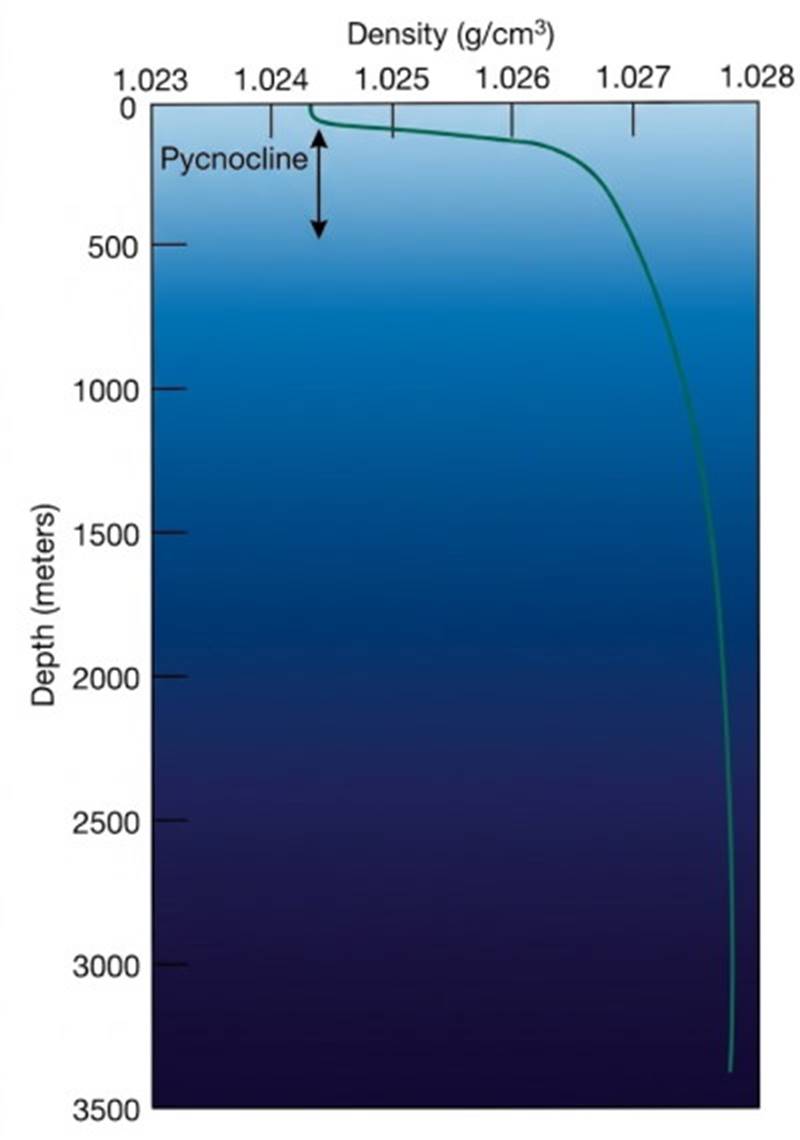
Fig. 6.10. Density increases with depth in seawater. The pycnocline is the region in which density changes rapidly with depth. (Based on data from the northeastern Pacific Ocean.)
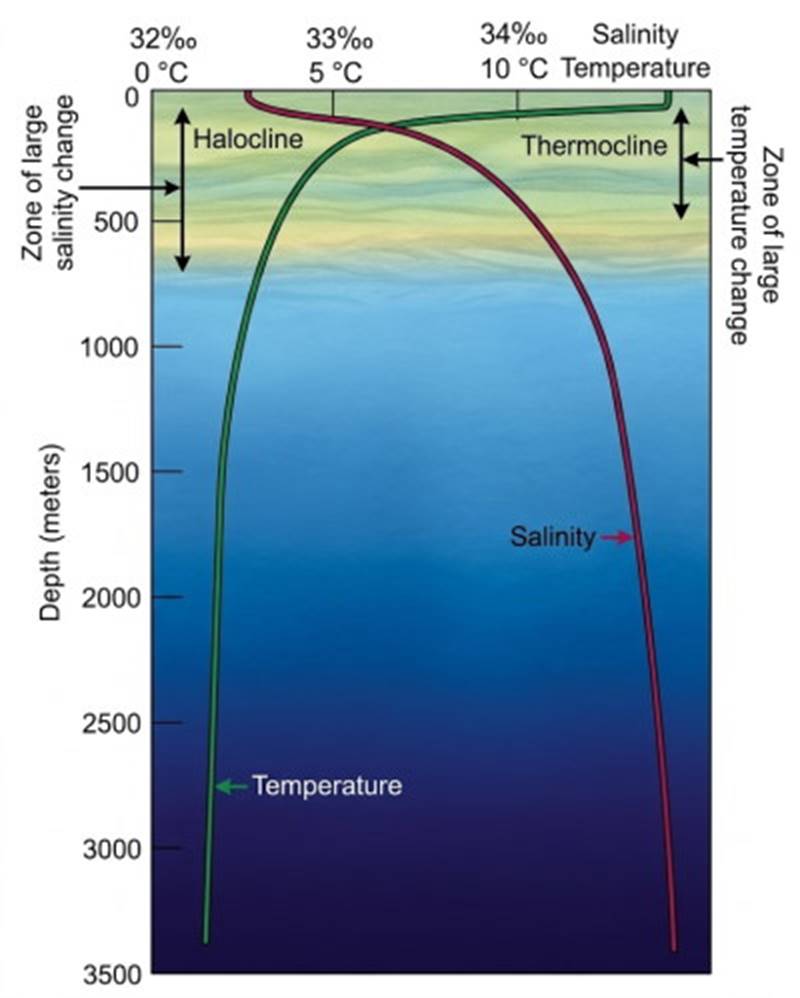
Fig. 6.11. Temperature and salinity values change with depth in seawater. Rapid changes in temperature and salinity with depth produce a thermocline and a halocline, respectively. (Based on data from the northeastern Pacific Ocean.)
If the density of the water increases with depth, the water column from surface to depth is stable. If there is more-dense water on top of less-dense water, the water column is unstable. An unstable water column cannot persist; the denser surface water will sink and the less-dense water at depth will rise to replace the surface water. Vertical overturn of the water takes place.
If the water column has the same density over depth, it has neutral stability and is termed isopycnal. A neutrally stable water column is easily vertically mixed by wind, wave action, and currents. If the water temperature is unchanging over depth, the water column is isothermal; if the salinity is constant over depth, it is isohaline.
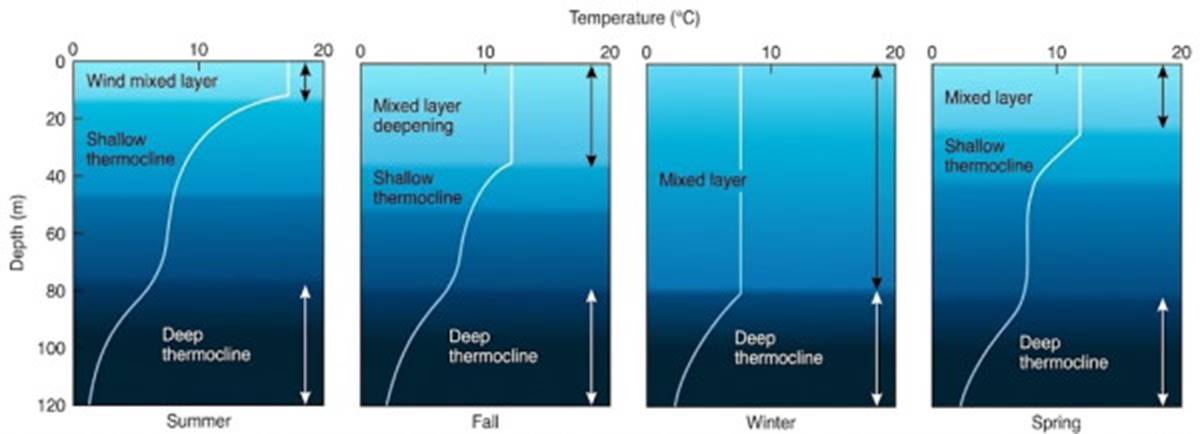
Fig. 6.12. The surface-layer temperature structure varies over the year. In the absence of strong winds and wave action in the summer, solar heating produces a shallow thermocline. During the fall and winter, the surface cooling and storm conditions cause mixing and vertical overturn, which eliminate the shallow thermocline and produce a deep wind-mixed layer. In spring the thermocline re-forms. The deep thermocline is below the influence of seasonal surface changes and remains in place year-round.
Density-Driven Circulation. Processes that increase the water's density at the surface cause convective water movement, or vertical circulation, ensuring an eventual top-to-bottom exchange of water. Because the density is normally controlled by surface changes in temperature and salinity, this vertical circulation is known as thermohaline circulation. An excellent example of thermohaline circulation occurs in the Weddell Sea of Antarctica, where the winter cooling and freezing produce dense, cold, more-saline surface water that sinks to the sea floor. This water descending along the coast of Antarctica is the densest water found in the open oceans.
At the temperate latitudes in the open ocean the surface water's temperature changes with the seasons. This effect is illustrated in figure 6.12. During the summer the surface water warms and the water column is stable, but in the fall the surface water cools, its density increases, and overturn begins.
Winter storms and winter cooling continue the mixing process. The shallow thermocline formed during the previous summer is lost, and the upper portion of the water column is vertically mixed and becomes isothermal to greater depths. Spring brings warming, and the thermocline begins to reestablish itself; the water column becomes stable and remains so through the summer.
Seasonal temperature changes are more important than salinity changes in altering density in the open ocean below polar latitudes. For example, in the Atlantic Ocean the surface water at 30°N and 30°S has a high salinity but is warm year-round, so it stays at the surface. In contrast, water from 50° to 60°N in the North Atlantic has a lower salinity, but it is cold, especially during the winter. This cold water sinks and flows below the saltier but warmer surface water.
Close to shore, the salinity of seawater can become more important than the temperature in controlling density. Salinity is particularly important in semi-enclosed bays, sounds, and fjords that receive large amounts of freshwater runoff. Here extremely cold (0° to 1°C) freshwater ice melt is added to the rivers. When this water meets the salt water, its salinity is so low that the water does not sink but remains at the surface as a seaward-moving freshwater lid. In polar regions, when the sea ice melts, a layer of fresh water forms at the surface and slowly dilutes the underlying surface water.
Sigma-t. Minute changes in density are responsible for relatively large changes in vertical circulation. For this reason, oceanographers routinely measure density to the fifth decimal place, for example, 1.02677 g/cm³. Because such a number is awkward to handle when performing calculations and processing large quantities of data, a more convenient term is used.
Density is converted to a sigma-t (σ_t) value. To derive sigma-t from density, divide the density by 1.000 g/cm³ (the density of pure water) to remove the units: 1.02677 g/cm³ / 1.00000 g/cm³ = 1.02677. Subtract 1 and multiply by 1000: (1.02677 - 1) × 1000 = 26.77, σ_t = 26.77.
In this special case pressure effects are disregarded, and σ_t becomes a factor related only to salinity and temperature, as indicated by the symbols σ for salinity and t for temperature. When the temperature is corrected for compression, sigma theta (σ_θ) may be used in place of σ_t.
Date added: 2026-11-09; views: 3;