
Innovative Ocean Measurement: Acoustic Tomography and Satellites
Acoustic Tomography. Acoustic tomography uses sound waves to make three-dimensional images of seawater properties and their fluctuations with time; it operates through ocean volumes of 1000 cubic kilometers (156 cubic nautical miles) or more. Conventional methods using ships or instruments moored to the sea floor would be enormously expensive, requiring hundreds of instruments deployed by a dozen ships to monitor ocean areas of this size. Satellites cannot be used for this work because they do not monitor the ocean's interior.
Acoustic tomography uses sound transmitters and sound receivers moored over area and depth (box fig. 6.10). This instrument array provides large quantities of data as each sound signal moves along a different path and through a different part of the water column on its way to a receiver. The amount of data can be increased by using transceivers in place of either transmitters or receivers; transceivers both transmit and receive sound.
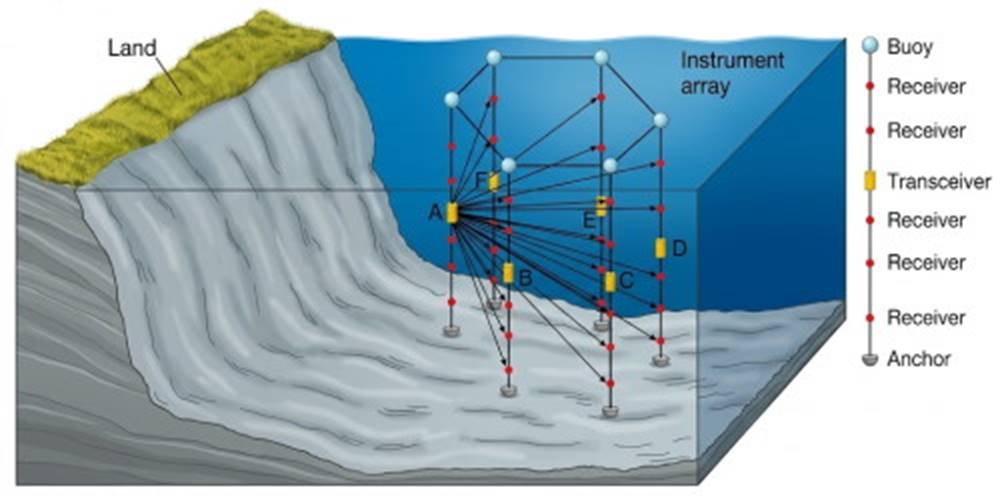
Box fig. 6.10. Buoys carrying strings of sound sources and receivers are anchored around a volume of water. Sound pulses from A are picked up by receivers on the other strings, and sound pulses are sent out in turn from the other sound devices (B–F). Changes in the speed and frequency of sound describe the properties of the water enclosed by the instrument array.
Sound speed and refraction are controlled by the salinity, temperature, and pressure of the seawater (refer to chapter 4). In acoustic tomography a sound pulse from any single transmitter is recorded by every receiver. The distances between the transmitter and the receivers are known; the time required for the sound pulse to travel between transmitter and receiver can be measured, so the speed with which each sound pulse travels can be calculated.
The speed of travel is controlled by the properties of the water through which the sound pulse passed. This process is repeated many times along different pathways. The data are then converted by computer into three-dimensional maps of the ocean's properties and their changes with time, in the same way that geologists construct maps of the Earth's interior from seismic wave data (see seismic tomography, discussed in chapter 3) or that physicians use CAT scans to form three-dimensional images of the body's internal organs.
In addition, the pitch, or frequency, of a sound pulse is altered by the currents. If a sound pulse of a given frequency is traveling through the water in the same direction that the water is moving, the pitch of the sound pulse increases. If the water motion opposes the sound path, the pitch decreases. In this way water movements, including ocean currents, can be detected and mapped.
Acoustic tomography presents the researcher with a versatile system adaptable to many situations. The researcher controls the size of the region investigated and the frequency of the measurements; there is the opportunity to study changes with space and time on both the large and the small scale. This system allows data to be analyzed and processed on board ship so that the research program can be modified while it is in progress. Another option is to have the moored instruments record and store data for future analysis, or the instruments can transmit their data to shore laboratories via satellite.
Drifting Buoys and Satellite Remote Sensing. A different approach uses drifting surface buoys with attached sensors. These buoys wander through the ocean, moving with the currents. They make measurements of water properties and broadcast them to passing satellites for relay to land stations.
Using GPS, satellites determine the changing position of the buoy and relay this information as well. Other instruments are adjusted to drift with the currents at a depth at which their density matches the density of the seawater. These devices gather data and periodically alter their buoyancy to rise to the surface and broadcast their stored information to passing satellites. They then sink again and repeat the process.
Other underwater acoustic devices can use the sound-transmitting properties of seawater to send data from experiment to analysis site. The underwater device converts digitized data into sound signals that are broadcast through the water to another device that converts the sound waves back to digital information for relay to a vessel or satellite.
Satellites give researchers continuous coverage of wide areas of the oceans, and the satellites' sensors supply vast quantities of data toward increasing our understanding of the oceans. By means of radar altimetry, which measures the distance between a satellite and the sea surface, researchers can map the uneven surface of the oceans. These data allow the calculation of local changes in the Earth's gravity, and from that information it is possible to map the sea floor.
Radar altimetry measurements can also be used to learn more about the tides, the surface currents, and atmospheric pressure changes. The scattering of satellite signals allows researchers to detect the roughening of the sea surface produced by wind waves and to relate this information to the surface winds blowing across the oceans. Because oil on the sea surface diminishes its natural roughness, satellites can detect oil spills. Specialized radar is also able to sense the presence of sea ice by measuring the changing properties of the sea surface.
The radiant energy released from the sea allows satellites to measure sea-surface temperature and color; these measurements are then related to the abundance of the small plantlike organisms that are the base of the ocean food chains. These examples and others are referred to throughout the chapters of this text. The tool box of techniques available to the oceanographer is ever increasing. In addition, more of the oceans can be sampled for longer periods of time and more accurately and definitively than ever before.
Date added: 2026-11-09; views: 2;