
Oceanographic Measurement, Water Masses, and Ocean Thermal Energy
T-S Curves 6.6. The distribution of salinity and temperature with depth produces distinct patterns in different areas of the oceans. If the salinity and temperature values at each observed depth are graphed on a temperature versus salinity diagram, known as a T-S diagram (refer to fig. 6.8), a curve of their distribution with depth is produced; this is a T-S curve.
T-S Curves and Water Masses. T-S curves made for large geographic areas of the oceans are similar in shape and fall within narrow zones on a T-S diagram. Figure 6.19 displays specific families of T-S curves; these have been given names and are referred to as water masses. Figure 6.20 shows the oceanic distribution of the water masses identified by the T-S curves in figure 6.19. Some of the water masses described by these T-S curves have very different characteristics at the surface but are much more uniform, with a limited range of salinity and temperature, at depth.
Where North Atlantic deep water and Antarctic bottom water are formed and sink to depth, the water is not layered, and approximately the same values for salinity and temperature are found at all depths. A water mass with only one temperature value and one salinity value over its entire extent is known as a water type. Antarctic bottom water meets the criteria for a water type, as is shown in figure 6.19.
T-S curves are an oceanographer's diagnostic tools. They are used to find errors in data and to indicate the density stability of the water column at different depths. Oceanographers working with T-S diagrams and T-S curves become so familiar with their distribution patterns that they can inspect a set of temperature-salinity values over a series of depths and know in what area of the world's oceans the measurements were made.
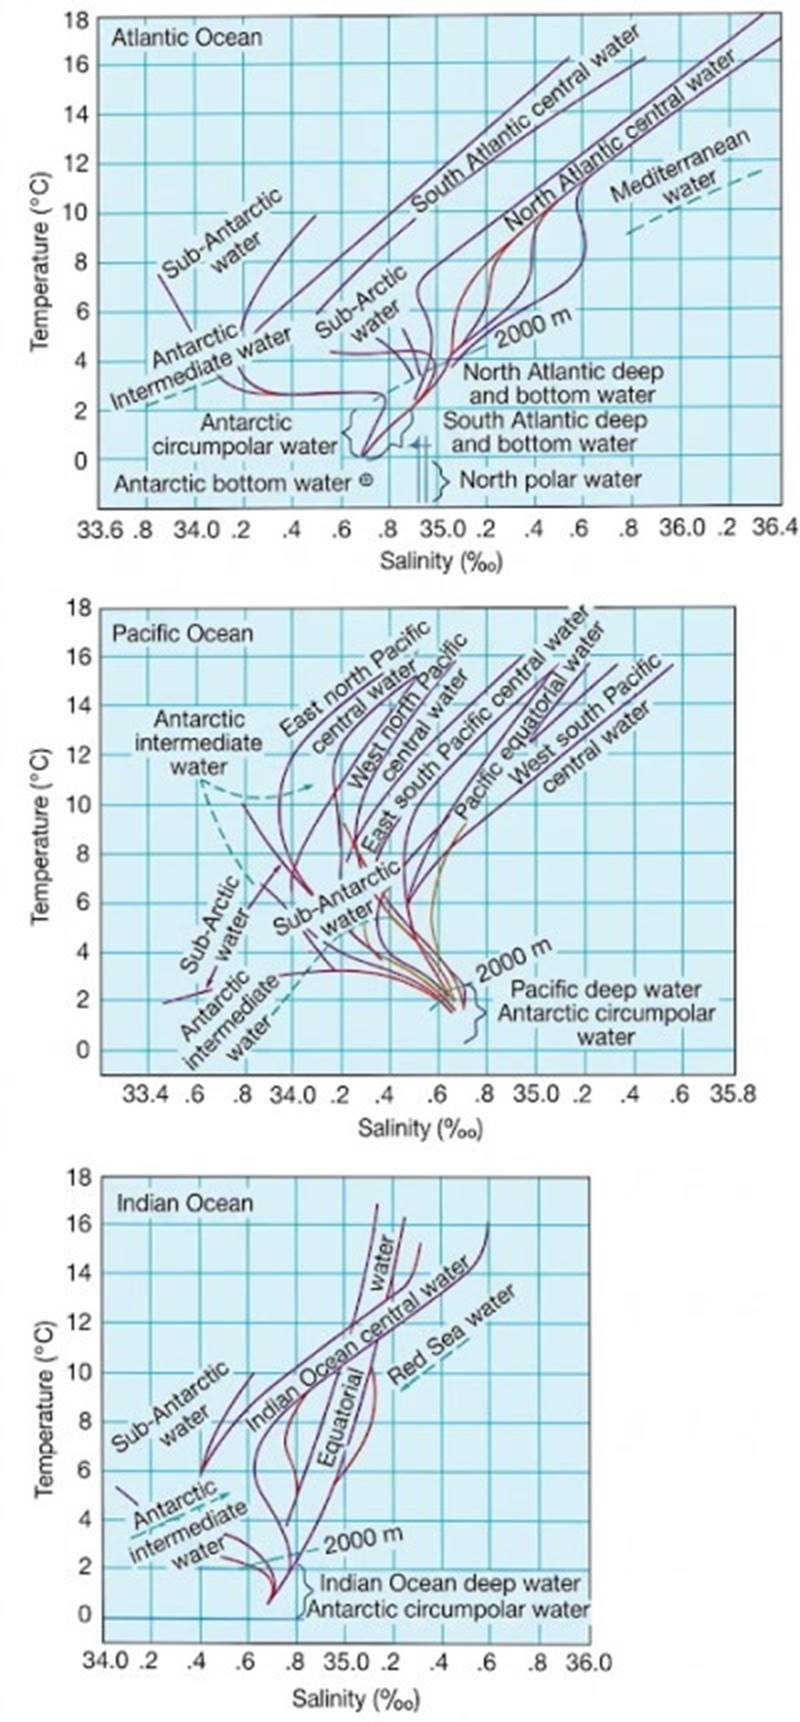
Fig. 6.19. T-S curves describe the vertical structure of the oceanic water masses. Paired salinity and temperature values from surface to sea floor are used to construct these curves.
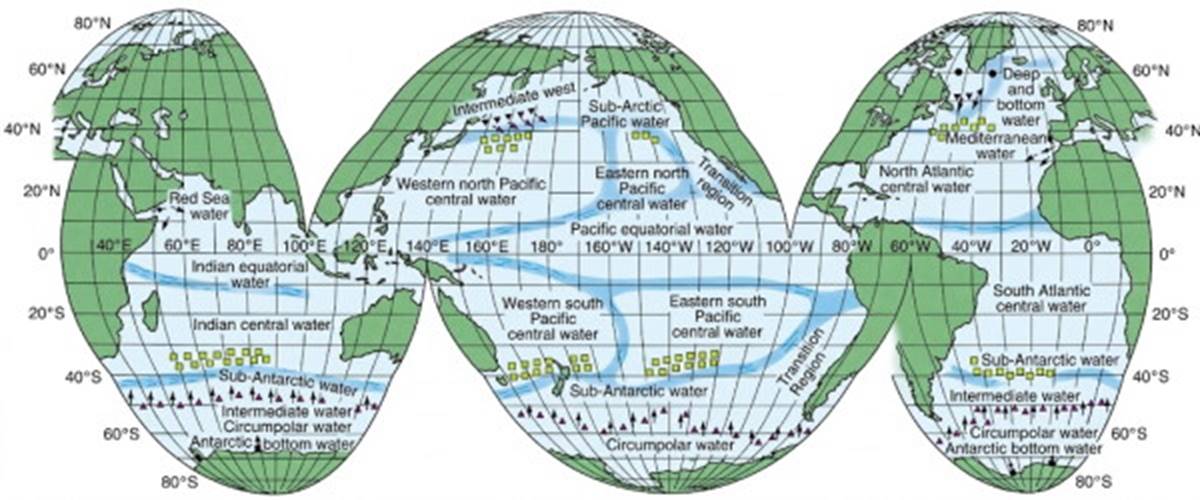
Fig. 6.20. The geographic distribution of water masses that have similar vertical salinity and temperature distributions. Open squares mark the regions in which the central and shallow waters are formed; triangles indicate the lines along which the intermediate and deep waters sink; solid circles indicate the formation of bottom water.
Measurement Techniques 6.7. Measuring the salinity, temperature, dissolved gases, nutrients, suspended matter, and other characteristics of seawater in situ requires that the oceanographer devise specialized sampling and measuring equipment and a platform from which the equipment can be used or deployed. The research vessel is the traditional platform from which samples are taken and measurements are made (see the photo essay, Going to Sea, pages 276–279).
These vessels are equipped with winches and cables that launch, lower, and retrieve instruments; laboratories for specialized on-board research; and a large array of measuring devices, including depth recorders, sonar, speed and direction sensors, atmospheric and solar radiation sensors, and many more. However, research time at sea is expensive, for vessels require fuel, living amenities, and professional merchant crews as well as oceanographers. Total vessel and crew costs are high: $25,000 and more per operating day, not including the scientific party and equipment. Therefore, researchers need to be able to gather accurate information in the least amount of time.
Historical and Modern Sampling. The oceanography of the first fifty years of this century depended on robust mechanical devices that were lowered into the sea, took their samples at preset depths, and returned those samples to the ship for later analysis. Today's oceanographers still use bottom corers and grabs, dredges, and nets, but the standard use of long cables with their attached water bottles and thermometers (fig. 6.21) is decreasing rapidly.
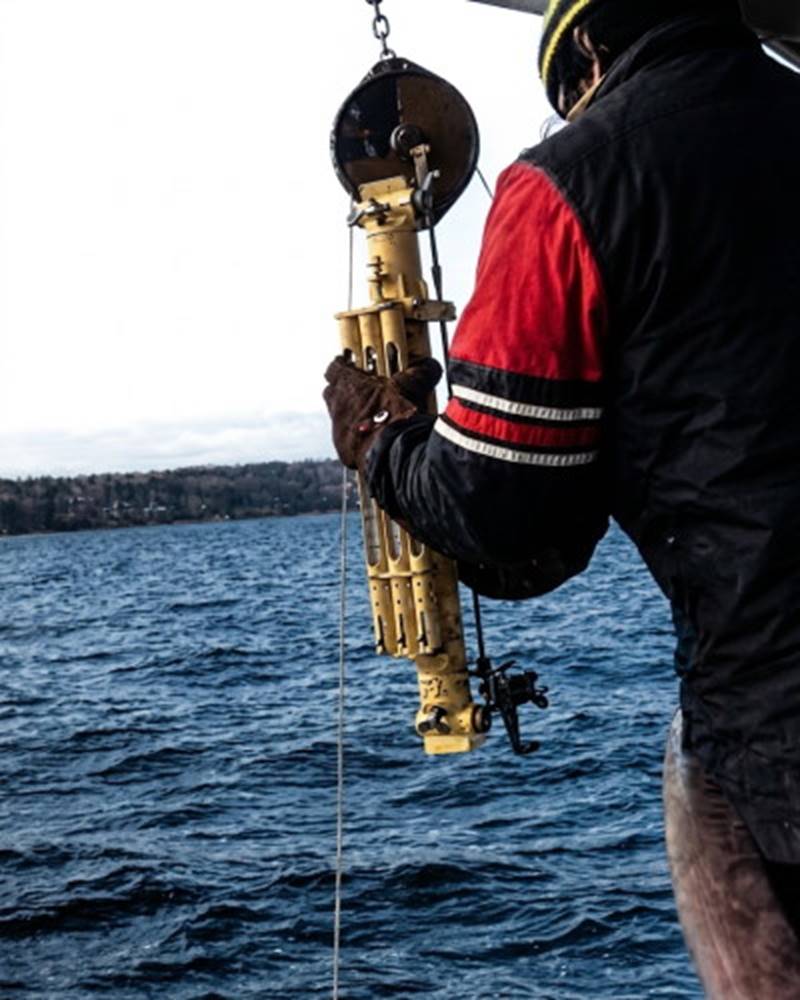
Fig. 6.21. Hanging a water bottle. A mechanical water bottle with three deep-sea thermometers attached is fastened to a cable. When the water bottle reaches the desired depth it will be signaled to close by a weight that slides down the cable. At the time the water sample is taken, the temperatures registered by the thermometers will be fixed. Sample depth is set by measuring the cable as it passes over a meter wheel at the top of the photograph.
The conductivity-temperature-depth sensor, or CTD (fig. 6.22), is today's workhorse, providing a depth profile of salinity by measuring electrical conductivity of the seawater. A temperature profile is obtained with an electrical resistance thermometer, and depth readings are made with a pressure sensor. The CTD is lowered in a protective cage that contains a series of water bottles and may also carry other sensors such as pH probes, chlorophyll sensors, optical scanners, and dissolved oxygen sensors.
Conductivity and temperature are monitored continuously as the CTD is lowered and the data are returned to the ship as electronic signals through the suspending cable. On board ship, the conductivity-temperature-depth data may be fed directly into the computer, recorded on a chart, or made available as numerical data. Continuous profiles of data to several thousand meters can be acquired in this way, whereas the old water bottles collected only one sample at each depth for later analysis.
CTD systems still require a research vessel to stop and remain on station while the instrument is lowered, measurements are made, and the CTD is recovered. However, the CTD can also be left in place, suspended from a surface vessel or buoy; the collected data can be stored on magnetic tape for retrieval at another time.
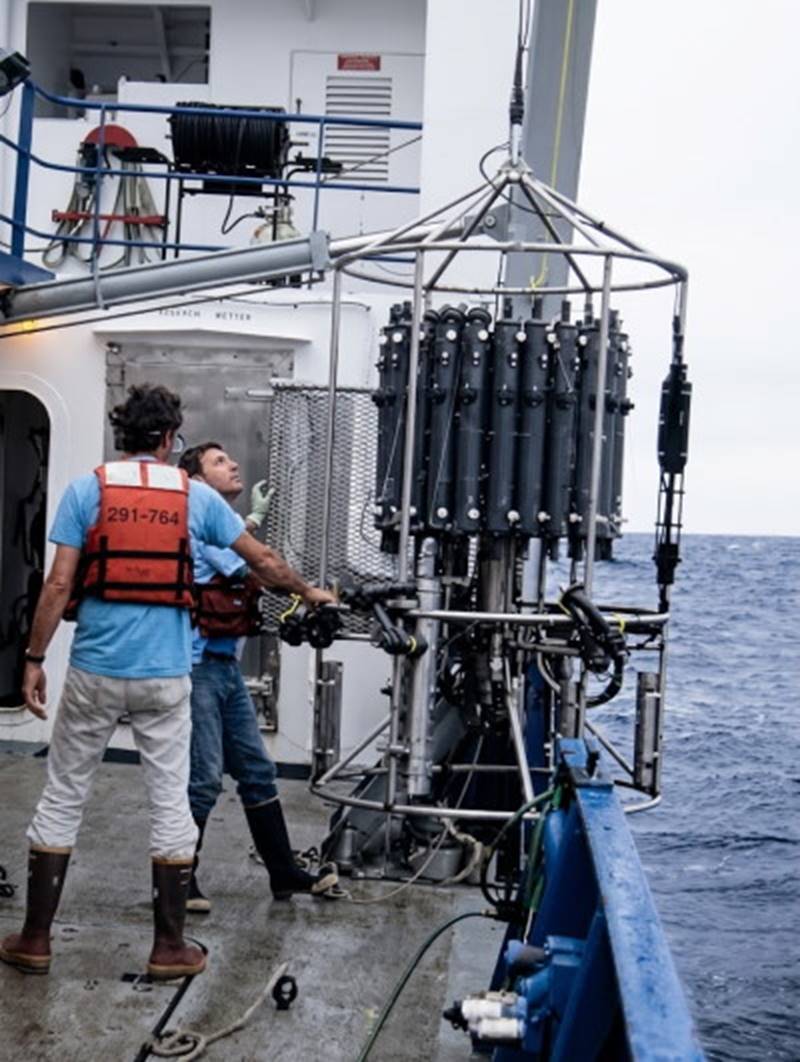
Fig. 6.22. Retrieving a conductivity-temperature-depth sensor, or CTD. The CTD is attached below a rosette of water bottles. Data are relayed to the ship's electronic processing and data center. Water samples are taken when an interesting water structure is found or when water samples are required to calibrate the CTD.
Seasoar (fig. 6.23) is a modified CTD device that allows sampling while the vessel is under way. The Seasoar is a winged vehicle that is towed behind a ship. Its depth is controlled by the device's diving planes and can be compared to flying a kite upside down under water. Its vertical range extends from the surface to about 350 m (1100 ft) and its dive cycle takes about 10 minutes to complete, compared with the standard CTD, which, with stop and start time for the vessel, takes about 40 minutes. The Seasoar's sensors record continuously, both horizontally and vertically, while it dives.
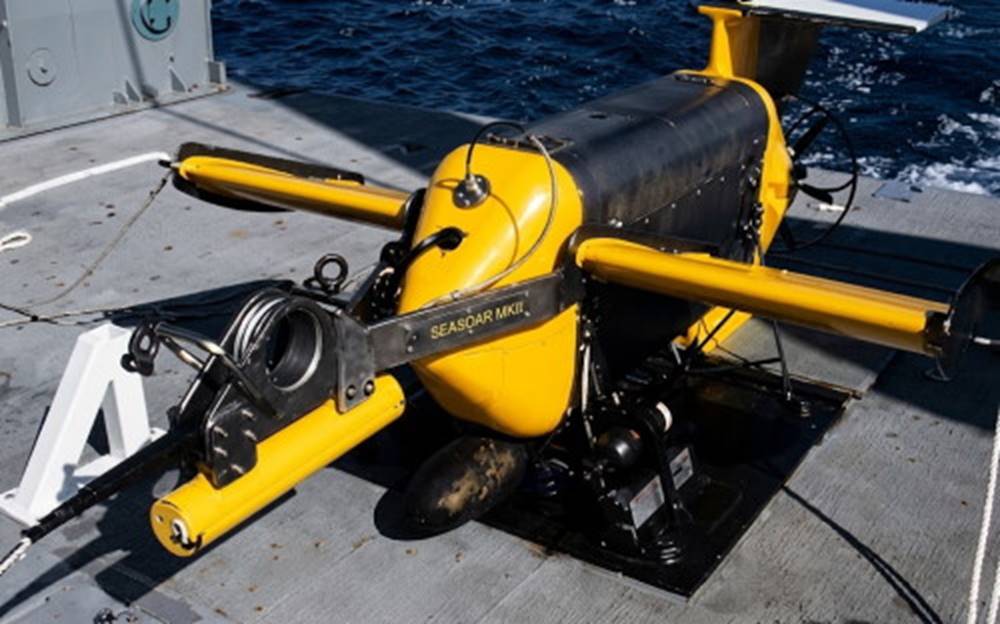
Fig. 6.23. Seasoar sits on the deck before deployment. The bomb underneath is for stability, the impeller at the back drives the hydraulic pump controlling the wings that allow Seasoar to move vertically while it is towed horizontally. Devices to measure radiation, temperature, and conductivity are located next to the bomb.
Not all marine studies require a large research vessel with its sophisticated and expensive equipment. Inshore, shallow-water studies usually use smaller vessels with less-sophisticated equipment. Small winches driven by power or even by hand are used to lower mechanical water bottles with their thermometers to the required depth. Lightweight electronic instruments are also available and include devices to measure conductivity, temperature, dissolved oxygen, optical properties, pH, and fluorescence of chlorophyll.
For sampling larger ocean areas than can be served by each research ship and for continuous sampling over long periods of time, other types of platforms are used more and more frequently and have become increasingly important to ocean research. Surface buoys, subsurface buoys, submersibles, robots, and satellites carry sophisticated instrumentation and can accomplish longer-term projects and cover wider ocean areas than any research vessel.
Practical Considerations: Ocean Thermal Energy Conversion 6.8. An indirect form of solar energy and an alternative to fossil fuel production of energy is found in the sea. The transparency and heat capacity of water allow large amounts of solar energy to be stored in the ocean, and this heat can be extracted independent of daily and seasonal changes in the available solar radiation.
Ocean thermal energy conversion (OTEC) depends on the difference in temperature between ocean surface water and water at 600–1000 m (2000–3300 ft) depth. There are two types of OTEC systems: (1) closed cycle (fig. 6.24a), which uses a contained working fluid with a low boiling point, such as ammonia or Freon, and (2) open cycle (fig. 6.24b), which directly converts seawater to steam.
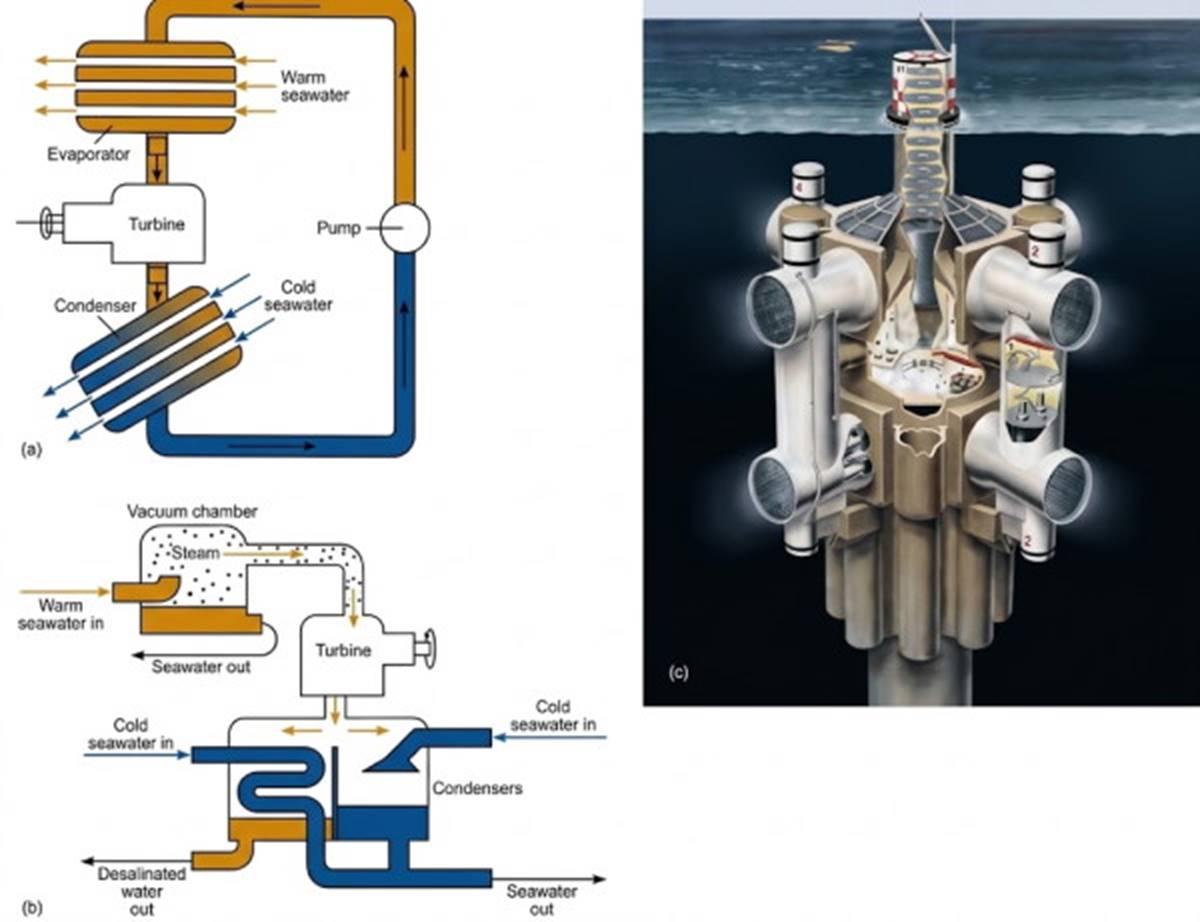
Fig. 6.24. (a) The simplified working system of an OTEC (ocean thermal energy conversion) closed-system electrical generator. (b) The simplified working system of an OTEC open-system electrical generator. (c) The concept drawing for the Lockheed OTEC Spar.
In a closed system, the warm surface water is passed over the evaporator chamber containing the ammonia or Freon, and the ammonia or Freon is vaporized by the heat derived from the warm seawater. The vapor builds up pressure in a closed system, and this gas under pressure is used to spin a turbine, which generates power. After the pressure has been released, the ammonia or Freon is passed to a condenser, where it is cooled by cold water pumped up from depth. Cooling the ammonia or Freon returns it to its liquid state, and it is pumped as a liquid back to the evaporator to repeat the cycle.
In the open system, large quantities of warm seawater are converted to steam in a low-pressure vacuum chamber, and the steam is used as the working fluid. Because less than 0.5% of the incoming water is turned into steam, large quantities of warm water must be used. The steam passes through a turbine, is condensed in a condenser cooled by cold water from depth, and turns into desalinated water.
OTEC plants using either system can be located onshore, offshore, or on a ship that moves from place to place. Figure 6.24c is an engineering concept design for an independent, free-floating OTEC plant. The Lockheed Spar has not been built, and there are no current plans to do so. OTEC requires at least a 20°C difference in temperature between surface and depth to generate useful amounts of energy.
This means that these power plants would be located at latitudes between approximately 25°N and 25°S with both warm surface water and cold deep water available; seawater temperature difference over depth must average 22°C. Avery and Wu (1994) estimated that the area of the world's oceans meeting OTEC requirements is 60 × 10⁶ km² (23 × 10⁶ mi²). The total power generated within this area would exceed 10 × 10⁶ MW (megawatts); the total U.S. electricity generating capacity in 1987 was 1.64 × 10⁶ MW.
Engineers studying the potential and feasibility of OTEC estimate that about 0.2 MW of usable power can be extracted per square kilometer of tropical ocean surface; that is about 0.07% of the average absorbed solar energy. They consider the process to be safe and environmentally benign. However, the pumping of cold water from depth to the sea surface to cool the OTEC condensers brings nutrients from depth and liberates them into the nutrient-poor tropical surface water, thereby changing the productivity of the surface water.
The Natural Energy Laboratory of Hawaii near Keahole Point operates a land-based, open-system OTEC plant. This pilot project produces a net of 100 kw of power per day using the temperature differences between the water at the ocean's surface and water about 800 m (2,500 ft) below the surface. It also produces 26,000 L (7,000 gal) of desalinated water per day. This pilot project began producing power in 1992 and is the world's only system pumping cold water from depth.
The cost of the plant is high, about ten times the cost of a conventional plant burning coal or oil; however, OTEC fuel is free. Maintenance costs are estimated at about the same as or less than those for a fossil fuel plant and much less than those for a nuclear power plant.
Private companies and pilot projects associated with the Hawaiian project use the nutrient-rich cold water pumped from depth for aquaculture projects, including production of oysters, shrimp, fish, black pearls, and various seaweeds. The deep seawater is also being used as a coolant to provide air conditioning for the buildings at Keahole Point at a cost of one-tenth of that of electricity. Another experimental use for this seawater as a coolant is to manipulate soil and air temperatures in order to grow crops such as strawberries, asparagus, and lettuce, which do not grow well under local conditions.
The potential uses of deep water as a by-product of OTEC power generation led to the formation of the OTEC/DOWA (Deep Ocean Water Applications) association in 1989. The association held an international conference in the United Kingdom in 1994. The conference concluded that the OTEC/DOWA combination is an attractive alternative to established power facilities for a number of world locations. They cited its benign impacts on the environment and lack of carbon dioxide production as strong arguments for its use and concluded that OTEC power production is the most promising area of solar-derived energy.
Summary. The intensity of solar radiation over the Earth's surface varies with latitude. Incoming radiation and outgoing radiation are equal when averaged over the whole Earth. Reflection, reradiation, evaporation, conduction, and absorption keep the heat budget in balance with the incoming solar radiation. In any local area of the oceans there is daily and seasonal variation.
Winds and ocean currents move heat from one ocean area to another to maintain the surface temperature patterns. The oceans gain and lose large quantities of heat, but their temperature changes very little. The heat capacity of the oceans is high compared with that of the land and the atmosphere. Heat absorbed at the surface mixes downward to reduce the temperature change at the surface.
The salinity of surface water reflects the pattern of evaporation and precipitation with latitude. Cooling, evaporation, and freezing increase the density of the sea surface water. Heating, precipitation, and ice melt decrease its density. The surface water changes its density with changes in salinity and temperature that are keyed to latitude. The densities at depth are more homogeneous.
Thermoclines and haloclines form where the temperature and salt concentrations change rapidly with depth. If the density increases with depth, the water column is stable; unstable water columns overturn and return to a stable distribution. Neutrally stable water columns are mixed vertically by winds and waves.
Vertical circulation that is driven by changes in surface density is known as thermohaline circulation. In the open ocean, temperature is more important than salinity in determining the surface density. Salinity is the more important factor in areas that are close to shore and to land runoff. Sigma-t is a convenient way of representing density.
Water sinks at downwellings and rises at upwellings. A downwelling occurs at the convergence of surface currents and transfers oxygen to depth. Upwellings bring nutrients to the surface and occur at zones of surface current divergence. Chemical tracers are also present.
The oceans are layered systems. The layers (or water types) are identified by specific ranges of temperature and salinity. The water types of the Atlantic Ocean are formed at the surface at different latitudes. They sink and flow northward or southward. Water enters and exits the Arctic Ocean from the North Atlantic. The water types of the Pacific Ocean lose their identity in the large volume of this ocean; their movements are sluggish. The water types of the Indian Ocean are less distinct than those of the Atlantic, with no water types that correspond to those formed in the northern latitudes. Mediterranean Sea and Red Sea waters enter the Atlantic and Indian oceans at depth as discrete water types that can be tracked for long distances.
Water masses occupy distinct regions of the oceans and have specific patterns of salinity and temperature from surface to depth. Characteristic values of temperature and salinity for these water masses are identifiable when plotted on T-S diagrams.
Today's oceanographer depends on the CTD (conductivity-temperature-depth) sensor. CTDs take profiles of salinity by measuring the electrical conductance of seawater. Temperature is obtained with an electrical resistance thermometer, and depth with pressure sensors. Seasoar is a towed CTD modified to take samples when the ship is under way. Shallow-depth measurements can be made with mechanical water bottles and thermometers.
OTEC (ocean thermal energy conversion) generates energy by using the difference in temperature between ocean surface water and deeper water. A land-based, open-system OTEC plant is operating in Hawaii.
Date added: 2026-11-09; views: 4;