
Atmospheric Dynamics: Structure, Greenhouse Gases, and Ozone Depletion
The Atmosphere 7.1. The atmosphere is a nearly homogeneous mixture of gases extending 90 km (54 mi) above the Earth. Ninety-nine percent of the mass of atmospheric gases is contained in a layer extending upward 30 km (18 mi), and 90% is within a layer extending only 15 km (9 mi) above the Earth's surface.
The Structure of the Atmosphere. The first layer of atmosphere above the Earth is the troposphere; here, the temperature decreases with altitude, changing from a mean Earth surface value of 16°C to −60°C within 12 km (7 mi). The tropopause marks the minimum temperature zone between the troposphere and the layer above it, the stratosphere. In the stratosphere the temperature increases with increasing elevation until the stratopause is reached at 50 km (30 mi) (fig. 7.1).
The troposphere is warmed from below by heat reradiated and conducted from the Earth's surface and by evaporation of water vapor and its condensation in the atmosphere. Refer to figure 6.2 and the discussion of the heat budget in chapter 6. Precipitation, evaporation, convective circulation, wind systems, and clouds are all found within the troposphere.
Ozone, an unstable form of oxygen, occurs principally in the stratosphere. Each ozone molecule, O₃, is made up of three molecules of oxygen instead of two, as found in the oxygen, O₂, at the Earth's surface. Ozone absorbs ultraviolet radiation from sunlight and therefore raises the temperature of the stratosphere. By absorbing ultraviolet radiation, the ozone layer lowers the incidence of ultraviolet light at the Earth's surface, protecting it from the high-intensity ultraviolet radiation that is harmful to living organisms.
At elevations extending higher than 50 km (30 mi) there is little absorption of solar radiation, so the temperature again decreases with height in the layer known as the mesosphere. Here the number of molecules of gas per cubic centimeter is reduced by one thousand, and the pressure from the remaining atmosphere is only 1/1000th of the pressure at the Earth's surface. The mesosphere extends upward to 90 km (54 mi), and above the mesosphere, the thermosphere extends out into space. See again figure 7.1.
The emphasis of this chapter is on the troposphere, for within this layer heat and water move between the Earth's surface and the atmosphere, causing the motions that produce the winds, the weather, the ocean's waves, and ocean surface currents. The tropopause is also of interest, because this is the region of the high-altitude winds called jet streams that play a role in wind systems and storm tracks. Understanding these upper-level dynamics is essential for modern meteorological forecasting.
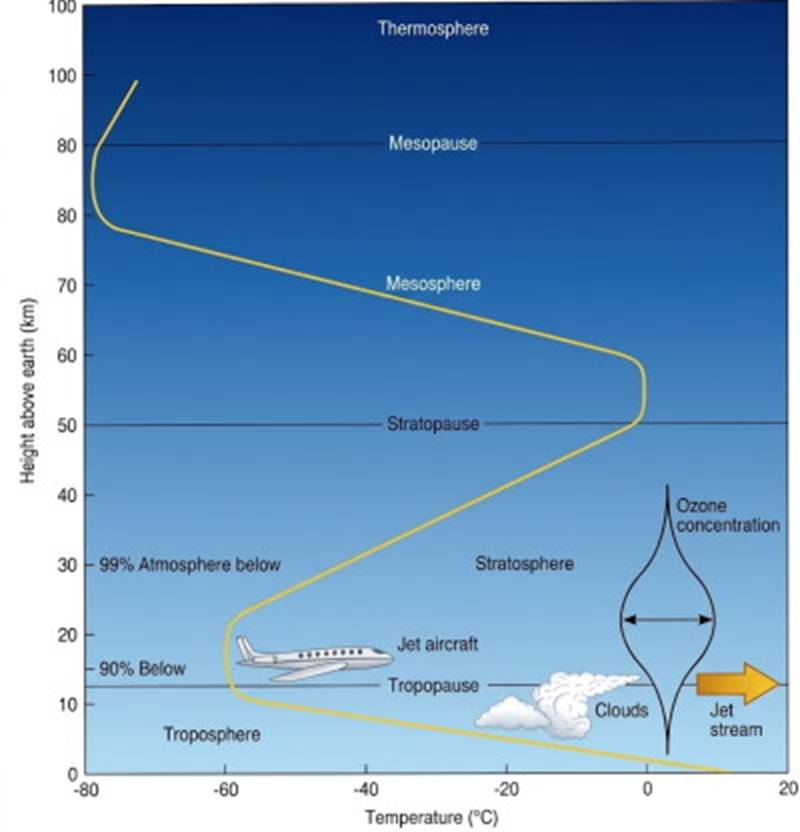
Fig. 7.1. The structure of the atmosphere. The distribution of air temperature with height is shown by the yellow line.
The Composition of Air. Air is a mixture of gases; the gases that make up dry air are listed in table 7.1. Air usually contains about 1.4% water vapor, a small amount when compared with 21% oxygen, but important in controlling the air's density. Water vapor has a density that is less than the density of dry air; when water vapor is present, the total percent of other gases is reduced, and at a constant temperature and pressure air saturated with water vapor is less dense than dry air.
Air becomes less dense when it is warmed, when its atmospheric pressure is decreased, and when its water vapor content is increased. Air becomes denser when it is cooled, when its atmospheric pressure is increased, and when its water vapor content is decreased. Changes in the density of air allow air to move vertically and cause atmospheric convective motion.
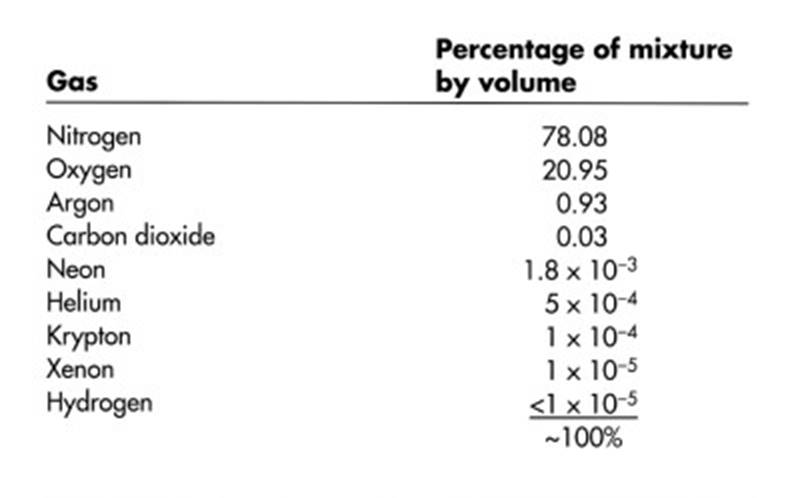
Table 7.1 The Composition of Dry Air
Atmospheric Pressure. Atmospheric pressure is the force with which a column of overlying air presses on an area of the Earth's surface. The average atmospheric pressure at sea level is 1013.25 millibars (1 bar = 1 × 10⁶ dynes/cm²), or 14.7 lb/in². This standard atmospheric pressure is also equal to the pressure produced by a barometer's column of mercury standing 760 mm (29.92 in) high. Barometers may measure atmospheric pressure in millibars or in millimeters or inches of mercury. Pressure can also be recorded in torrs, where 1 torr equals the pressure of a column of mercury 1 millimeter high.
Atmospheric pressure distribution is shown on weather charts by lines of constant pressure, or isobars (fig. 7.2). Where the density of the air is less than average, atmospheric pressure is below average, and a low-pressure zone is formed. Regions of air with a density greater than average are known as high-pressure zones.
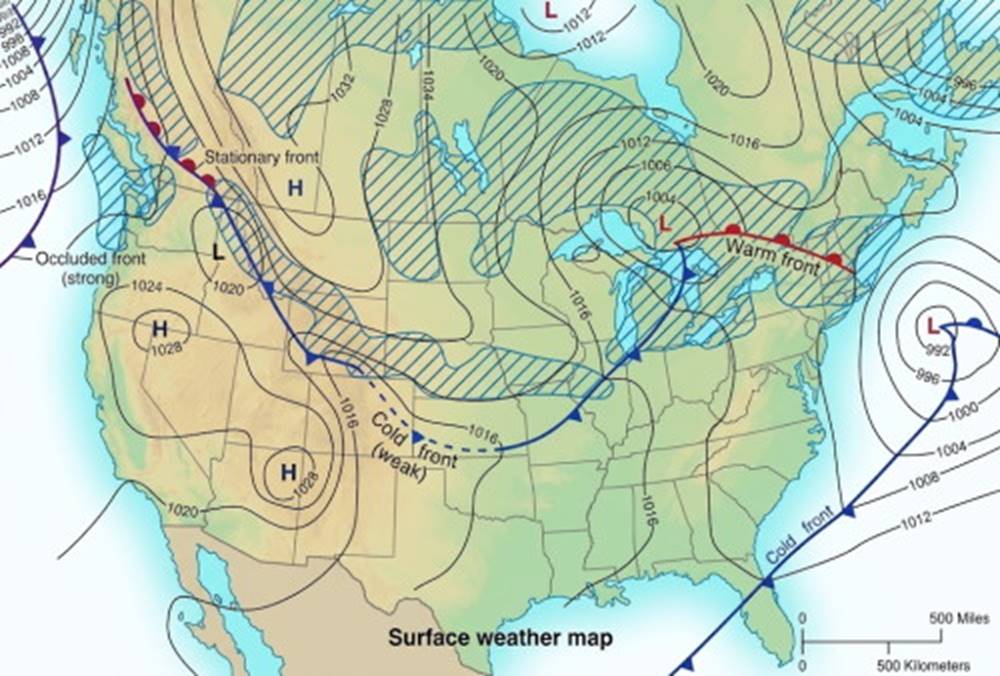
Fig. 7.2. Isobars are in millibars. The closer the isobars are to each other, the stronger the winds. H is high pressure; L is low pressure; cross-hatching is rain. Cold fronts occur when cold dense air wedges itself under less-dense, warmer air. Warm fronts are produced when less-dense, warm air moves over denser, colder air.
Atmospheric Gases 7.2. The atmosphere exerts primary control over the Earth's climate, and during the last forty-five years it has become increasingly evident that the balance of the gases present in the Earth's atmosphere is changing. Human activities appear to be causing these changes, and there is particular concern about the changes in concentration of greenhouse gases, which include most importantly water vapor and carbon dioxide as well as ozone, nitrous oxide, and others.
Carbon Dioxide and the Greenhouse Effect. There are three active reservoirs for carbon dioxide (CO₂): the atmosphere, the oceans, and the terrestrial system; in addition there is the inactive geological reservoir of the Earth's crust. The oceans store the largest amount of CO₂, and the atmosphere has the smallest amount (fig. 7.3). The atmosphere is the link with the other reservoirs, and the ocean plays a major part in determining the atmosphere's concentration of CO₂ through physical (mixing and circulation), chemical, and biological processes.
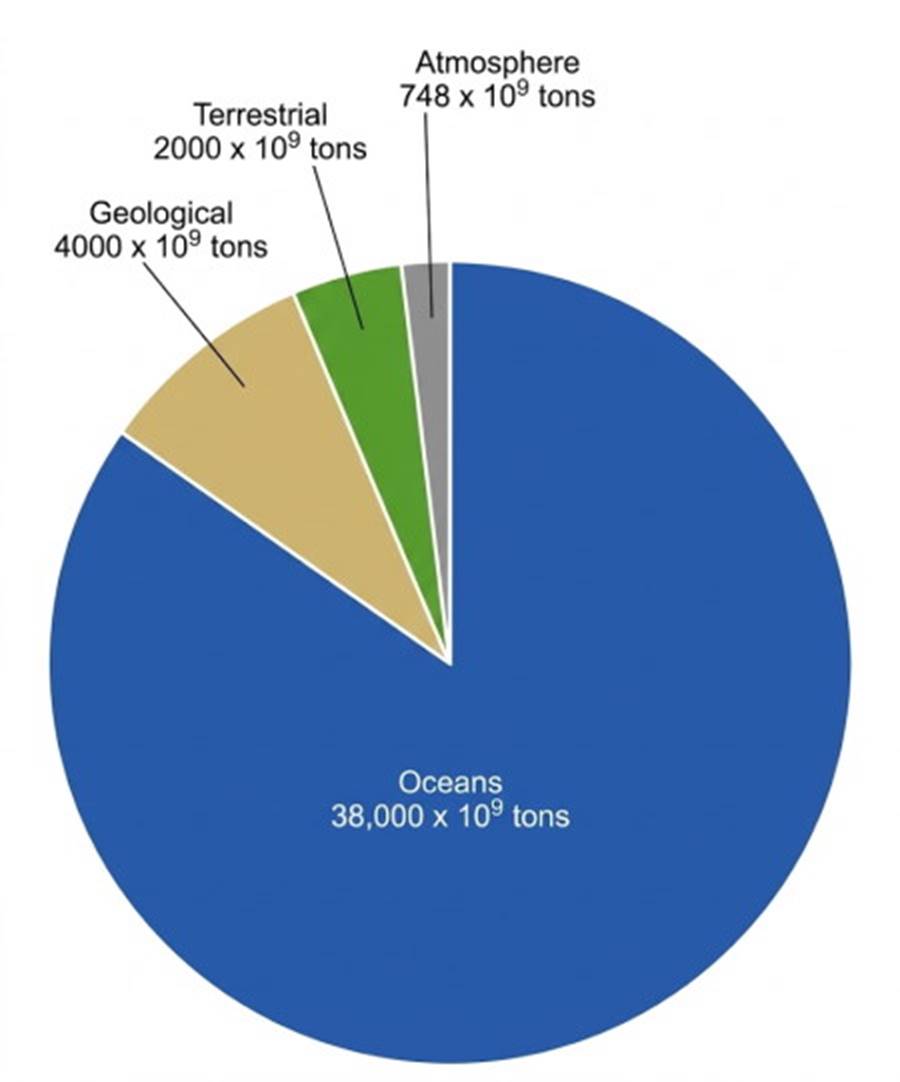
Fig. 7.3. World carbon dioxide distribution.
Atmospheric carbon dioxide (CO₂) is transparent to incoming solar radiation, but at the same time it reduces by absorption the rate of outgoing long-wavelength radiation from the Earth. In this way the Earth and its atmosphere are warmed by what is commonly known as the greenhouse effect. In the Northern Hemisphere the natural cycle of the world's carbon dioxide shows decreasing atmospheric CO₂ in the spring and summer. At this time plants increase active photosynthesis and remove CO₂ in greater amounts than that contributed by respiration and decay.
In the fall and winter, the photosynthetic activity is reduced, plants lose their leaves, and decay processes release CO₂; atmospheric carbon dioxide increases. The effects of deforestation and conversion of forest land to agriculture, the burning of fossil fuels, and the growth of human populations have been superimposed on this natural cycle. In preindustrial times the human impact on this seasonal cycle was small and the cycle was in balance.
Since 1850 and the Industrial Revolution, however, the concentration of carbon dioxide in the atmosphere has increased from 280 parts per million (ppm) to 350 ppm. Recently, the average rate of increase has been 1.4 ppm per year. For more than forty years scientists have been recording a steady increase in the carbon dioxide concentration in the Earth's atmosphere due to the burning of coal, oil, and other fossil fuels (fig. 7.4).
If the increasing trend continues, the concentration of carbon dioxide will double its 1850 value sometime before the middle of the next century. This increase will warm the Earth and alter its average heat budget by reducing the surface heat loss to space by long-wave radiation. Instead, more long-wave radiation will be absorbed into the atmosphere, increasing its temperature and forcing it to lose more long-wave radiation to space in order to maintain the heat budget of the Earth and atmosphere systems (chapter 6).
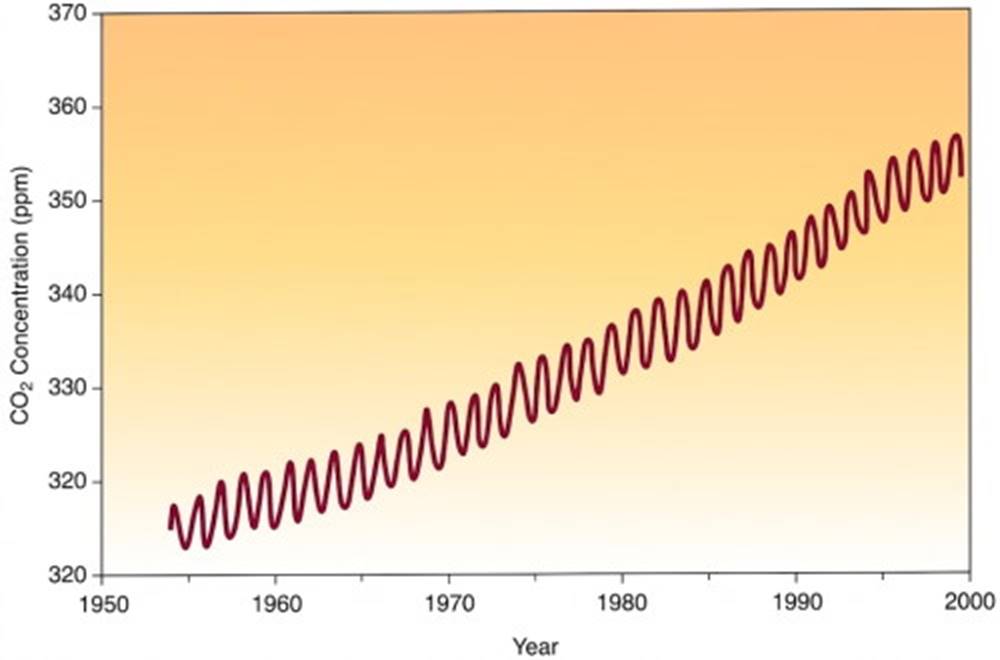
Fig. 7.4. Concentration of atmospheric carbon dioxide in parts per million (ppm) of dry air versus time in years observed with a continuously recording nondispersive infrared gas analyzer at Mauna Loa Observatory, Hawaii.
Based on this trend of increasing CO₂, climate researchers have predicted global warming of 2°–4°C in the next hundred years. Accurate measurements of the Earth's warming periods are relatively recent. A twenty-year warming period began in 1920; temperatures increased again in 1977 and remained high through the 1980s. Neither of these periods achieved the predicted warming rate of approximately 0.25°C per decade required by the present CO₂ concentrations.
Because different researchers assign different levels of importance to the many factors that affect the Earth's global temperature, results of research studies vary, and there is spirited debate over the causes and the rate of global warming. Some researchers point to changes in Sun spot cycles; others consider atmospheric aerosols of dust from human and natural sources significant because they could govern cloud formation. Natural events promote global cooling as well as global warming. For example the 1991 discharge of large amounts of debris and gas by the eruption of the Philippine volcano Mount Pinatubo caused Earth cooling of about 0.5°C and made 1992 the coolest year since 1986. This cool period has been followed by continued warming, each succeeding year warmer than the last through 1998. In time, reliable global models will be achieved to show us how much and by what means changes in Earth and atmospheric temperatures are related to increasing levels of carbon dioxide.
The annual world production of CO₂ from fossil fuels and the burning of tropical forests is slightly more than 6 billion tons. The increase in atmospheric CO₂ accounts for about 3 billion tons annually; however, this rate is not constant but varies with events such as El Niño (section 7.7). The most recent research on storage of CO₂ in the oceans estimates that about 2 billion tons enter the oceans and ocean sediments annually; refer to the discussion of carbonate sediments in chapter 3 and of dissolved CO₂ in seawater in chapter 5.
At least 1 billion tons are thought to be taken up by the temperate forests growing back from eighteenth- and nineteenth-century logging and the intense growth of the plants of tropical regions. The exact rates at which this CO₂ is transferred from one reservoir to another are difficult to measure, and the pathways followed by the CO₂ are difficult to trace. During the 1990s much was learned about the global carbon dioxide cycle, but predicting specific Earth reactions to increases of greenhouse gases requires further study.
In 1997 the Third Conference of Parties to the Framework Convention on Climate Change met in Kyoto. The Kyoto pact calls for thirty-eight industrial nations to cut their emissions of greenhouse gases by an average of 5.2% from 1990 levels by the year 2012. The United States, the world's leader in greenhouse gas emissions at 25% of the total, agreed to a 7% cut, and the nations of the European Union committed to 8%; Japan agreed to a reduction of 6%. If achieved, these levels will reduce projected 2012 emissions by two-thirds, but they will not prevent total greenhouse emissions from rising because developing nations that are not bound by the treaty, such as China, India, and Russia, are expected to account for about 58% of the world's total greenhouse emissions by the year 2012.
With global warming, several sea-surface scenarios are possible. It is expected that such warming would affect the higher latitudes, causing melting of polar land ice and raising the world sea level about 1 m (3 ft) by the year 2100. A decrease in sea ice could provide more open water for marine plant populations with a corresponding increase of photosynthesis, leading to increased carbon storage in the ocean reservoir.
Other possibilities are related to the interaction between the clouds, the oceans, and the Earth's surface (see the box, titled "Clouds and Climate," in this chapter). Changes in sea-surface temperature could also affect the thermohaline circulation (chapter 6) and the surface wind systems (later in this chapter) that drive the ocean currents. Changes in the ocean current patterns would modify the transfer of heat from low to high latitudes and alter the Earth's climate patterns. Also, increases in available atmospheric CO₂ have the potential to stimulate photosynthesis both on the land and in the oceans with unknown effects.
The Ozone Problem. Depletion of the stratospheric ozone layer that screens the Earth from much of the Sun's ultraviolet radiation was first reported in 1985 by members of the British Antarctic Survey who discovered that significant ozone loss had been occurring over Antarctica since the late 1970s. In 1990 the Antarctic ozone hole covered 18 × 10⁶ km², and in 1997 the hole covered 20.9 × 10⁶ km², an area more than twice the size of Europe. Satellites carrying total ozone mapping spectrometers (TOMS) have monitored the ozone situation since 1978 with increasing accuracy. Currently NASA's Earth Probe (EP) satellite is monitoring both the Antarctic and Arctic ozone holes (see fig. 7.5).
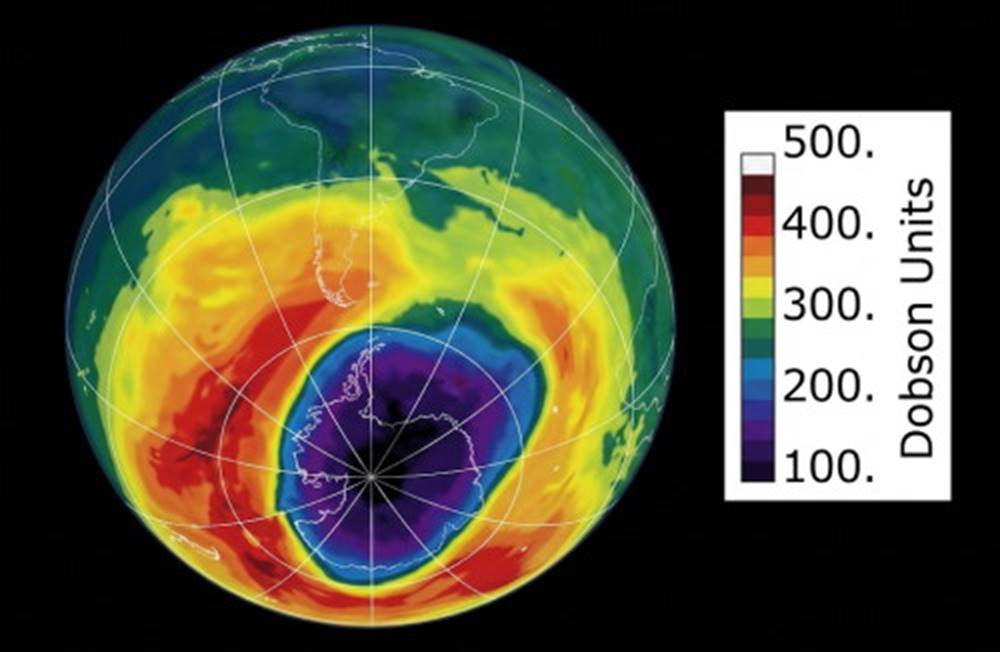
Fig. 7.5. Map of ozone over Antarctica measured on September 24, 1997, when the lowest annual value was recorded. A TOMS (total ozone mapping spectrometer) is carried by the NASA Earth Probe satellite launched in 1996. It replaces previous TOMS that have gathered data since 1978. Measurements are in Dobson Units (defined in glossary).
Arctic winters are not as cold as those of the Antarctic; therefore, ozone loss over the Arctic is less and the Arctic ozone hole is smaller. Nevertheless, the Arctic ozone hole covered approximately 6 × 10⁶ km² in March of 1997. The Arctic winter of 1996–97 was the fifth winter in a row in which the stratosphere over the Arctic had been particularly cold. The lowest recorded Arctic ozone level was measured in the spring of 1997.
There are three possible explanations for the colder conditions in the Arctic stratosphere between 1992 and 1997. Under conditions of decreasing ozone, the stratosphere is less able to absorb solar radiation and warm itself; the result is a destructive system of increasing cold that leads to lower ozone levels. Also, the increasing greenhouse gases trap heat in the lower atmosphere, and, because this heat does not reach the upper atmosphere, the stratosphere gets cooler. Last, some other variations in the Earth's climate or changes in the weather may be at work.
The most widely accepted theory of ozone destruction is related to the release of chlorine into the atmosphere. Chlorine is commonly released as a component of chlorofluorocarbons (CFCs). CFCs are used as coolants for refrigeration and air conditioning, as solvents, and in the production of insulating foams. CFCs are distributed throughout the troposphere by the winds and gradually leak into the stratosphere, where the ultraviolet light breaks them apart.
Gases in the atmosphere react with the chlorine and trap it in inert molecules, but in the presence of stratospheric clouds, which are common during the polar winter, the chlorine gas is freed to react with the ozone. In the presence of sunlight, chlorine and oxygen are formed, and the liberated chlorine is free to attack other ozone molecules. CFCs appear to have reached their maximum level in the troposphere and are expected to decline gradually as efforts to reduce their production continue. Because it takes many years for CFCs in the troposphere to work their way into the stratosphere, they will continue to destroy ozone for many years to come.
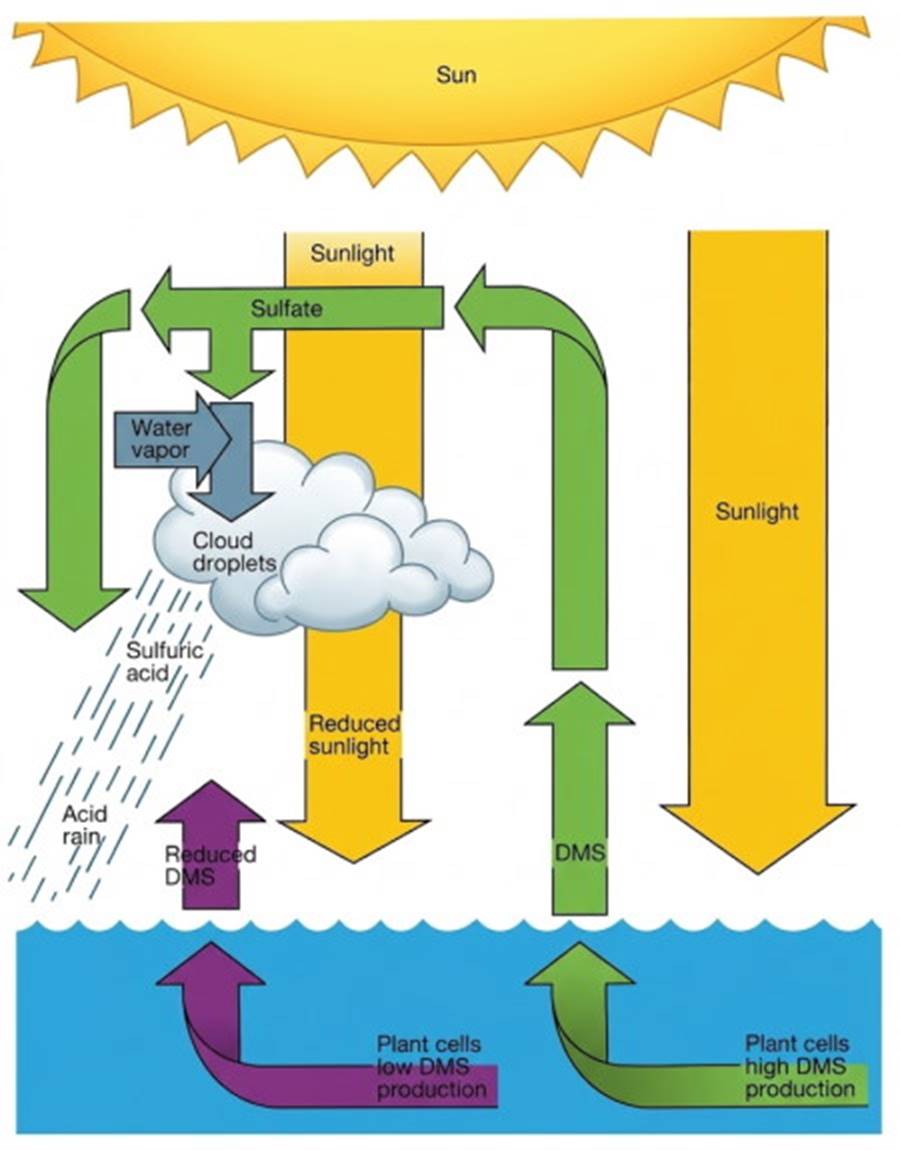
Fig. 7.6. A proposed self-supporting thermal control system linking dimethyl sulfide (DMS) to the sea surface and the atmosphere, a cycle among plants, the Sun, and clouds. Acid rain, pH ~ 3.5, has little impact on seawater because of seawater's carbon dioxide buffer.
Recently, methyl bromide has been identified as an even more efficient agent for breaking down ozone. It is thought to be responsible for as much as 20% of the Antarctic ozone depletion and 5% to 10% of the Earth's global ozone loss. Estimates place the input of methyl bromide to the atmosphere at 137 gigagrams (Gg) per year, of which 86 Gg/yr act directly to destroy ozone. Sources include microscopic single-celled organisms at the sea surface, pesticides, industry, and slow-smoldering burning of vegetation.
At ground level, ozone is a pollutant and a health hazard; in the stratosphere it absorbs most of the ultraviolet radiation from the Sun, protecting life forms on land and at the sea surface. The loss of ozone is a significant concern because a 50% decrease in ozone is estimated to cause a 350% increase in ultraviolet radiation reaching the Earth's surface. Increased ultraviolet radiation is responsible for increases in skin cancers and has been shown to affect the growth and reproduction of some organisms. The effects of increased ultraviolet radiation on the plantlike organisms of the surface layers of the Southern Ocean are discussed in chapter 14, section 6.
Date added: 2026-11-09; views: 4;