
Modifying Wind Bands: Seasonal Shifts, Monsoons, and Jet Streams
Modifying the Wind Bands. Transitioning from the idealized rotating, water-covered Earth model to the real Earth necessitates consideration of two additional critical factors:
1st factor: Seasonal changes in the Earth's surface temperature due to solar heating.
2nd factor: The inclusion of large continental land blocks.
Both ocean and land surfaces remain consistently warm at equatorial latitudes and cold at polar latitudes throughout the year, but middle latitudes experience significant seasonal temperature changes, ranging from warm in summer to cold in winter.
Thermal Properties of Land and Water. It is crucial to remember that land surface temperatures exhibit a greater seasonal fluctuation than ocean surface temperatures. This disparity arises because the heat capacity of ocean water is significantly greater than that of land. Furthermore, ocean water can transfer heat from the surface to depth in summer and from depth to the surface in winter. Land cannot transfer heat in this manner.
Seasonal Changes. The presence of both land and water in near-equal amounts at middle latitudes in the Northern Hemisphere produces distinct average seasonal patterns of atmospheric pressure. During warm summer months, the land heats up faster than the ocean. The air over the land is heated from below and rises, creating a low-pressure area, while the air over the sea cools and sinks, producing a high-pressure area over the water.
Latitudinal Pressure Zone Disruption. In the summer, low-pressure zones at 60°N and 0° tend to combine over land, cutting through the high-pressure belt along 30°N latitude. This phenomenon breaks the high-pressure belt into several high-pressure cells over the oceans rather than maintaining the continuous latitudinal zones of pressure stretching around the Earth. In the winter, the reverse is true at middle latitudes, where the land becomes colder than the water, and the air rises over the water and descends over the land, creating a low-pressure zone over the ocean.
Over the land, the polar high-pressure zone spreads toward the high-pressure zone at 30°N, breaking the low-pressure belt centered about 60°N into discrete low-pressure cells that are centered over the warmer ocean water. This middle-latitude, seasonal alternation of high- and low-pressure cells disrupts the latitudinal pressure zones and wind belts characteristic of the water-covered model, producing the air pressure distribution shown in figure 7.14.
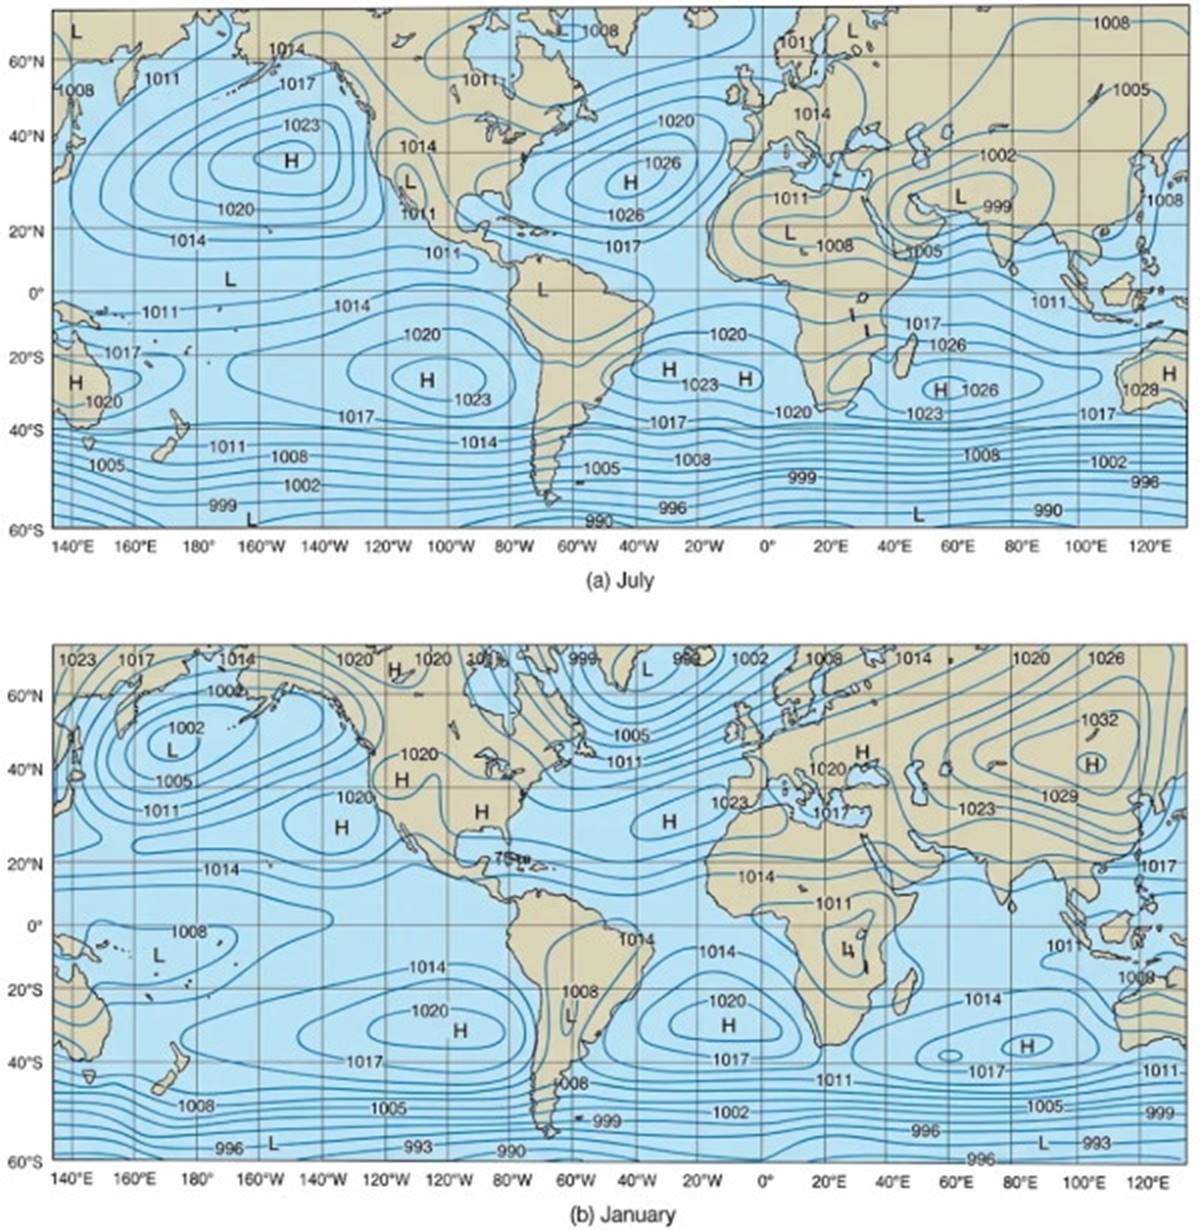
Fig. 7.14. Average sea-level atmospheric pressures expressed in millibars for (a) July and (b) January. Large landmasses at mid-latitudes in the Northern Hemisphere cause high and low atmospheric pressure cells to change their positions with the seasons. In the Southern Hemisphere, large landmasses do not exist at mid-latitudes, and average air pressure distribution changes little with the seasons.
During the Northern Hemisphere summer, the air in the high-pressure cells over the central portion of the North Atlantic and North Pacific oceans descends and flows outward toward the continental low-pressure areas. As the descending air moves outward, it is deflected to its right due to the Coriolis effect, producing winds that spiral in a clockwise direction about the high-pressure cells. The wind circulation around a high-pressure cell in the Northern Hemisphere is always clockwise.
On the northern side of these high-pressure cells are the westerlies, and on the southern side are the northeasterlies. The eastern side of the cell features northerly winds, and the western side has southerly winds. In the winter, the air circulates counterclockwise about the low-pressure cell over the northern oceans, and the prevailing wind directions reverse. The wind circulation pattern about a low-pressure cell in the Northern Hemisphere is always counterclockwise. The wind directions related to these pressure cells are shown in figure 7.15.
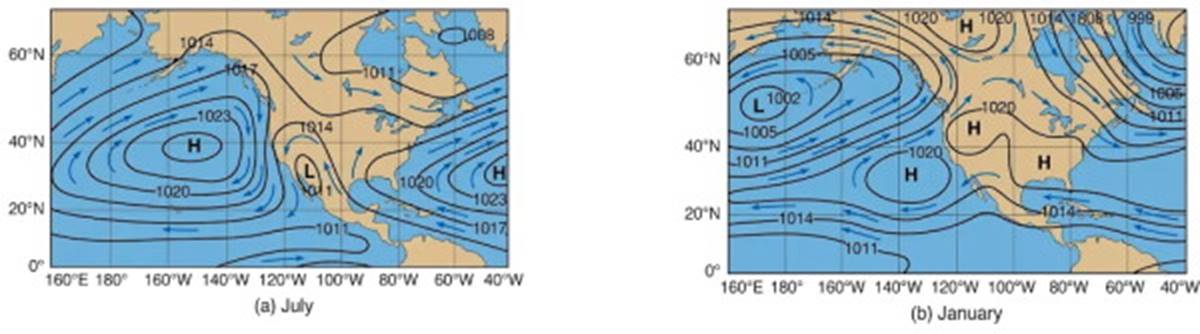
Fig. 7.15. Atmospheric pressure cells control the direction of the prevailing winds. Atmospheric pressures are expressed in millibars. In the Northern Hemisphere, air flows clockwise around a region of high pressure, and counterclockwise around a low-pressure area. (a) Average wind conditions for summer. (b) Average wind conditions for winter.
Along the Pacific coast of the United States, the northerly winds cool the coastal areas in the summer and the southerly winds warm them in the winter. The eastern United States receives warm, moist air from the low latitudes in the summer, and cold air moves down from the high latitudes in the winter. Although these seasonal changes modify the wind and pressure belts that were developed on the water-covered model, the generalized wind and pressure belts are still identifiable over the Earth in the northern latitudes when atmospheric pressures are averaged over the annual cycle.
Rotation of the airflow around high- and low-pressure air cells is reversed in the Southern Hemisphere because the Coriolis effect is opposite to that in the Northern Hemisphere. At middle latitudes in the Southern Hemisphere, there is relatively little land, and water temperature predominates. There is little seasonal effect; the atmospheric pressure and wind patterns created by surface temperatures change little over the annual cycle and are very similar to those developed for the water-covered model (see figs. 7.12 and 7.14).
The Monsoon Effect. The temperature differences between land and water produce large-scale and small-scale effects in coastal areas. In the summer along the west coast of India and in Southeast Asia, the air rises over the hot land, creating a low-pressure air system (fig. 7.16a). The rising air is replaced by warm, moist air carried on the southwest winds from the Indian Ocean.
As this onshore airflow rises over the land, it cools, causing its evaporation to decrease and condensation to increase. This process produces clouds and a steady heavy rainfall. This is the wet, or summer, monsoon. In the winter, a high-pressure cell forms over the land, and northeast winds carry dry, cool air southward from the Asian mainland and out over the Indian Ocean (fig. 7.16b). This movement produces cool, dry weather over the land, known as the dry, or winter, monsoon.
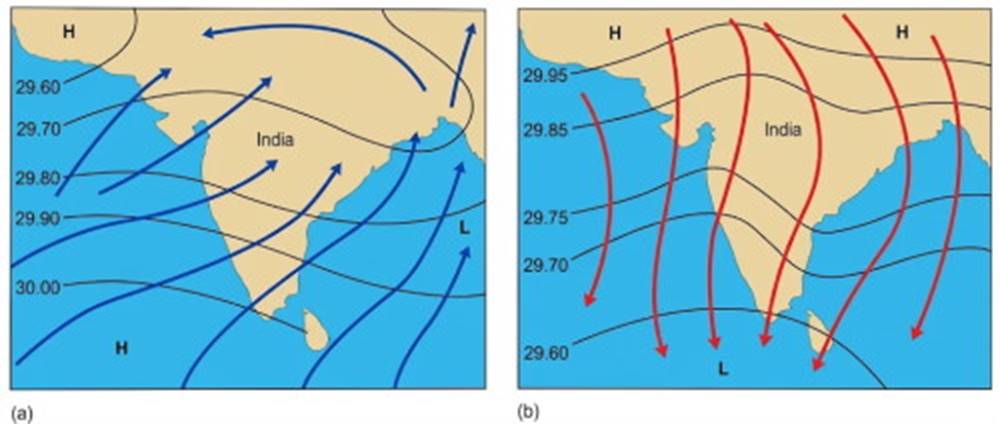
Fig. 7.16. The seasonal reversal in wind patterns associated with (a) the summer (wet) monsoon and (b) the winter (dry) monsoon. The isobars of pressure are given in inches of mercury. Land topography increases friction between winds and land, thereby decreasing the Coriolis effect. The winds blow more directly from high- to low-pressure areas across the isobars.
For years, coastal traders in the Indian Ocean who depended on sailing craft planned their voyages so that they sailed with the wind to their destination on one phase of the monsoon and returned on the next.
Land-Sea Breezes. The monsoon effect is also observed on a smaller local scale along a coastal area or along the shore of a large lake. During the day, the land is warmed faster than the water, and the air rises over the land. The air over the water moves in to replace it, creating an onshore breeze.
At night, the land cools rapidly, and the water becomes warmer than the land. Air rises over the water, and the air from the land replaces it, creating an offshore breeze. Such a local diurnal (once-a-day) wind shift is referred to as a land-sea breeze (see fig. 7.17). The onshore breeze reaches its peak in the afternoon when the temperature difference between the land and the water is at its maximum. The offshore breeze is strongest in the late night and early morning hours; sometimes one can smell the land twenty miles at sea, its odors carried by the offshore winds.
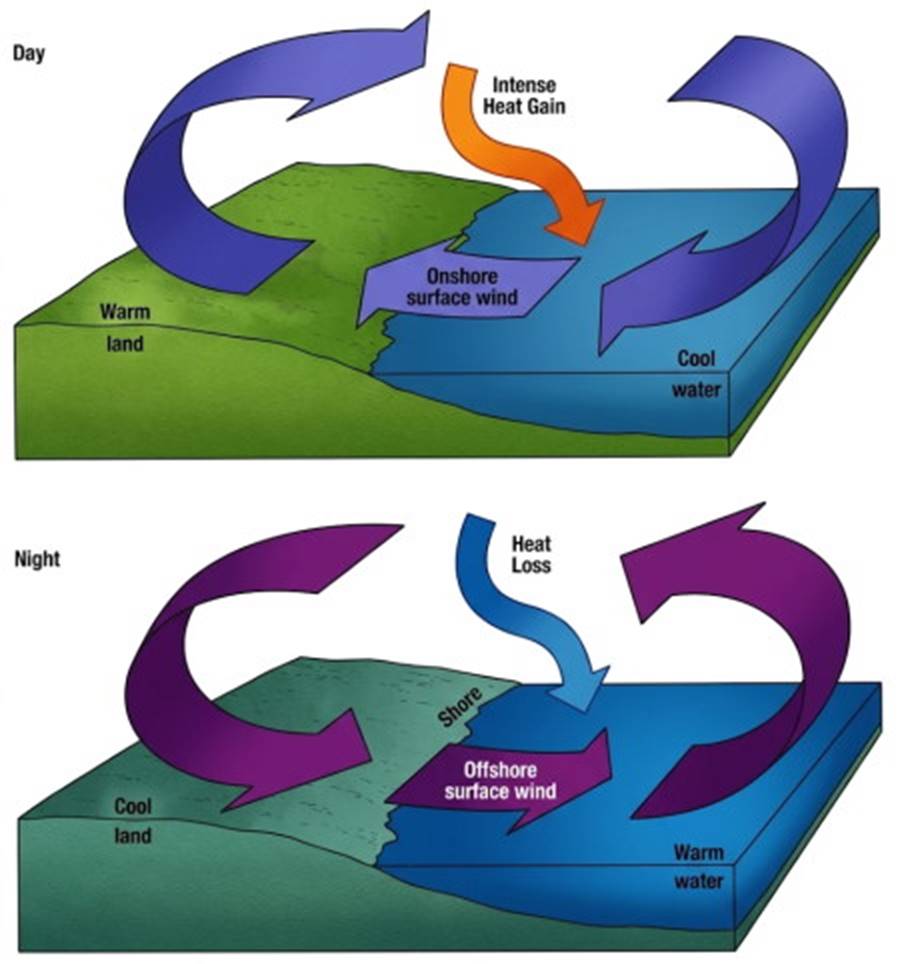
Fig. 7.17. Differences between day and night land-sea temperatures produce an onshore breeze during the day and an offshore breeze at night.
This daily wind cycle helps fishing boats that depend only on their sails to leave the harbor early in the morning and return late in the afternoon or early evening. This effect brings the summer fogs to San Francisco, California. The area east of San Francisco Bay heats up during the day, and the warm air over the land rises. When the warm marine air reaches the cold coastal waters, a fog is formed that pours in through the Golden Gate, obscuring first the Golden Gate Bridge and then the city (refer to fig. 4.21). When the air reaches the east side of the bay, it warms, and the fog dissipates. At night the flow is reversed, and the city is swept free of the fog.
The Topographic Effect. Because the continents rise high above the sea surface, they affect the winds in another way. As the winds sweep across the ocean, they reach the land and are forced to rise to continue moving across the land, as shown in figure 7.18. The upward deflection cools the air, causing rain on the windward side of the islands and mountains; on the leeward (or sheltered) side, there is a low-precipitation zone, sometimes called a rain shadow.
The Rain Shadow. For example, the windward sides of the Hawaiian mountains have high precipitation and lush vegetation, whereas the leeward sides are much drier and require irrigation. On the west coast of Washington State, the westerlies moving across the North Pacific produce the Olympic Rain Forest as the air rises to clear the Olympic Mountains. On the western side of the Olympic Mountains the rainfall is as much as 5 m (200 in) per year; 100 km (60 mi) away, in the rain shadow on the leeward side of the mountains, it is 40 to 50 cm (16–20 in) per year.
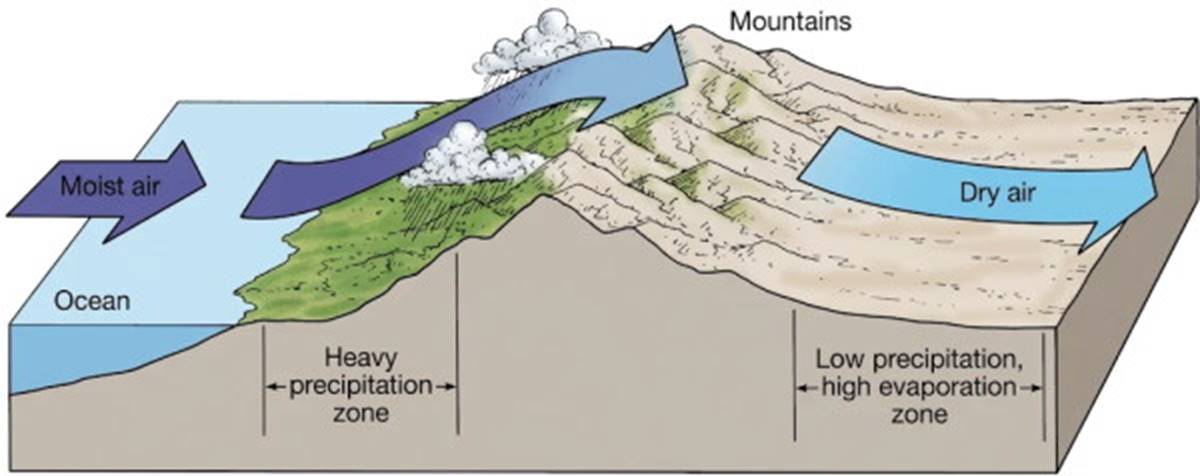
Fig. 7.18. Moist air rising over the land expands, cools, and loses its moisture on the mountains' windward side. Descending air compresses, warms, and becomes drier, creating a rain shadow on the leeward side.
The west side of the mountains of Vancouver Island in British Columbia has a high rainfall; the eastern side of the island is known for its sunshine and scenic cruising. The southeast trade winds on the east coast of South America sweep up and across the lowlands and then rise to cross the Andes Mountains, producing rainfall, large river systems, and lush vegetation on the eastern side of the Andes and a desert on their western slope.
Over the Indian subcontinent in summer the air approaching the Himalayas rises, intensifying the wet monsoon; air flows down from these mountains during the winter, the time of the dry monsoon. The control of precipitation patterns due to elevation changes is called the orographic effect.
The Jet Streams. Centered over zones of sinking and rising air near 50° to 60°N and S and 30°N and S are the jet streams, high-speed winds of the upper troposphere. The polar jet streams (50° to 60°N and S) are westerlies, lying above the boundary between the polar easterlies and the westerlies; the subtropical jet streams (30°N and S) are easterlies, found above the zone between the trades and the westerlies (fig. 7.19). The Northern Hemisphere polar jet stream is used as an example in the following discussion.
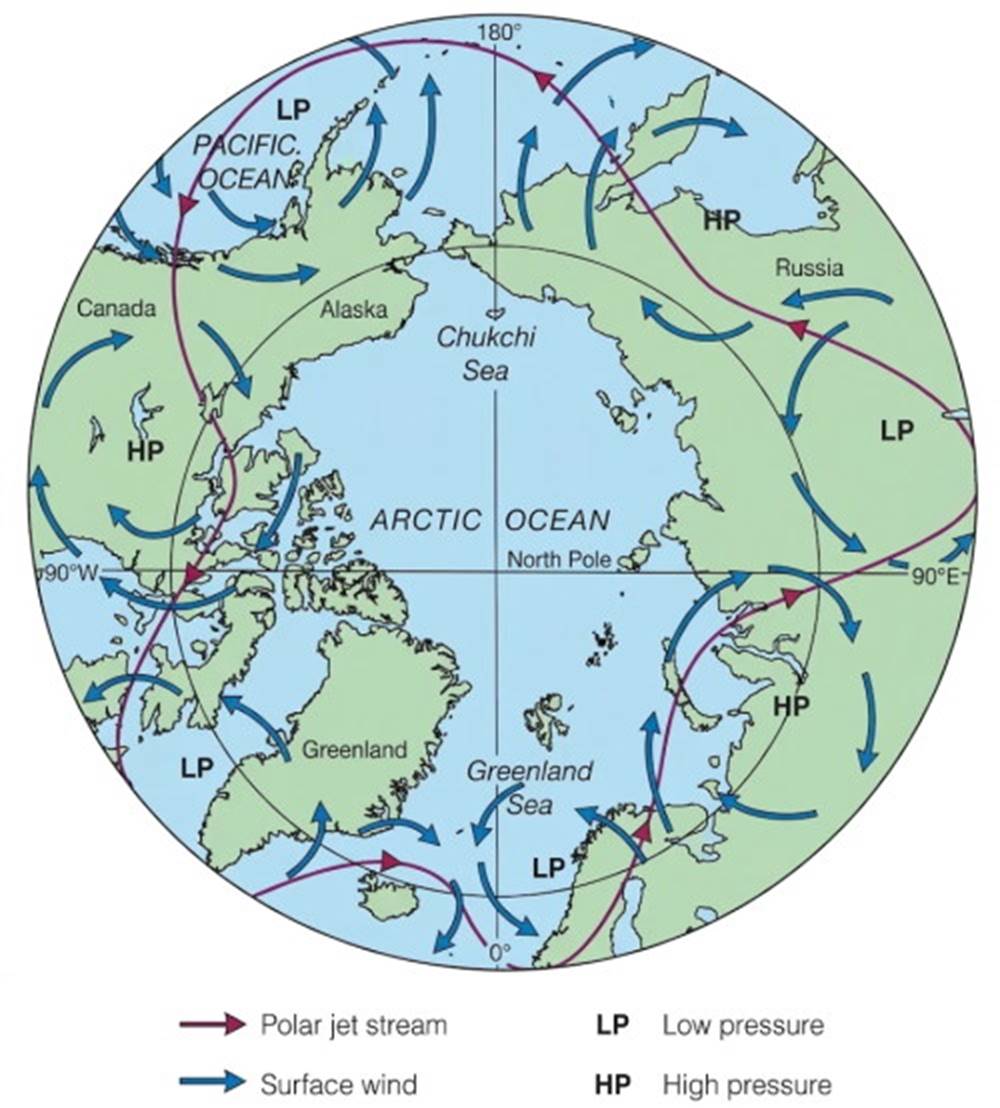
Fig. 7.19. The polar jet stream circles the Earth in the Northern Hemisphere above the boundary between the polar easterly winds and the westerly winds. It is deflected north and south by the alternating air-pressure cells of the northern temperate zone.
In the winter the polar jet stream flows rapidly, reaching 250 km/h (150 mi/h), and oscillates more than 2000 km (1250 mi) north to south. Wind speeds and displacement are reduced in the summer. The westerlies move the wave form of the stream and its associated high- and low-pressure systems eastward around the Earth. Oscillations in jet stream flow are caused by strong high-pressure systems to the south and intense low-pressure systems to the north. The location and movement of the polar jet stream are controlled by the location and strength of the boundary between subtropical and polar air and the shape of the temperate zone's alternating high- and low-pressure systems.
The position of the polar jet stream and the boundary between subtropical and polar air are important in determining the weather of the temperate zone. Circulation of air around these pressure systems transports warm subtropical air to higher latitudes and cold polar air to lower latitudes; refer to the discussion of the heat budget in chapter 6 and to figure 6.3. The most important source of heat in this system is the water vapor gained by excess evaporation in the subtropics and excess condensation as the air cools at higher latitudes. In the equatorial regions, great cumulus cloud systems form in the rising air of the doldrums and are moved westward by the subtropical jets.
Tropical Storms and El Niño: Dynamics of Global Weather Anomalies
Tropical Storms and Hurricanes. The dynamics of tropical weather systems are heavily influenced by variations in atmospheric pressure and sea-surface temperatures, leading to the formation of severe atmospheric disturbances.
Easterly Waves and Tropical Depressions. Although the trade winds of the tropics blow steadily, they may develop variations in speed and direction when the winds move over waters of changing temperature. These variations cause moving air to converge and then, as the air oscillates, to diverge; the resulting pressure disturbance is known as an easterly wave. It is visible as a sharp wrinkle in the isobars over the tropical oceans.
Hurricane Formation and Energy. If the sea-surface temperature is above 27°C, the atmospheric pressure decreases and the evaporation rate increases; the easterly wave develops into an intense, isolated, low-pressure cell, and a tropical depression is formed. The winds circle this depression counterclockwise in the Northern Hemisphere and clockwise in the Southern Hemisphere, build in strength, and the weather disturbance becomes a tropical storm and then a hurricane (fig. 7.20). The strong winds, in excess of 130 km/h (70 knots), that rotate about the low-pressure system associated with hurricane formation extract water vapor, and therefore heat, from the sea surface.
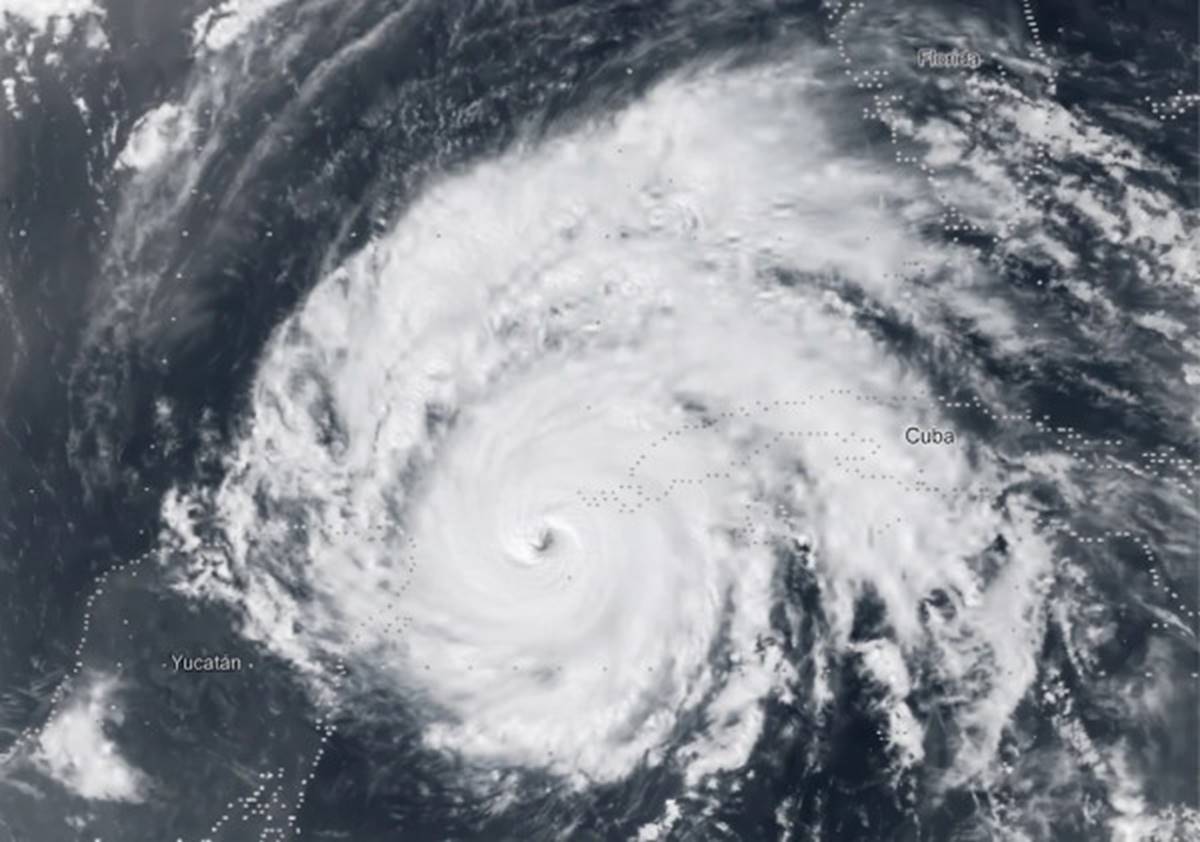
Fig. 7.20. Hurricane Allen in the western Caribbean, photographed by a NOAA satellite in 1980. The center, or eye, of the storm is the clear, calm hole in the ascending air. Winds circulate counterclockwise about the eye.
Energy Release and Dissipation. The large amounts of heat energy liberated from the condensing water vapor fuel the storm winds, raising them to destructive levels, up to 300 km/h (160 knots). A major hurricane contains energy exceeding that of a large nuclear explosion; fortunately, the energy is released much more slowly. The energy generated by a hurricane is about 3 × 10¹² watt-hours per day, the equivalent of the energy in 1 million tons of TNT. When these storms move over colder water or over land, the hurricane is robbed of its energy source and begins to dissipate. These storms bring not only strong winds but also high precipitation because of the very high rate of condensation associated with the rising warm, moist tropical air.
Global Nomenclature and Forecasting. Hurricanes can form on either side of the equator but not at the equator because the Coriolis effect is zero. When a storm of this type is formed in the western Pacific Ocean it is called a typhoon, or cyclone, instead of a hurricane. Areas that give rise to hurricanes and typhoons and their typical storm tracks are shown in figure 7.21. The surge of excessive high water that accompanies these storms is discussed in section 7.8.
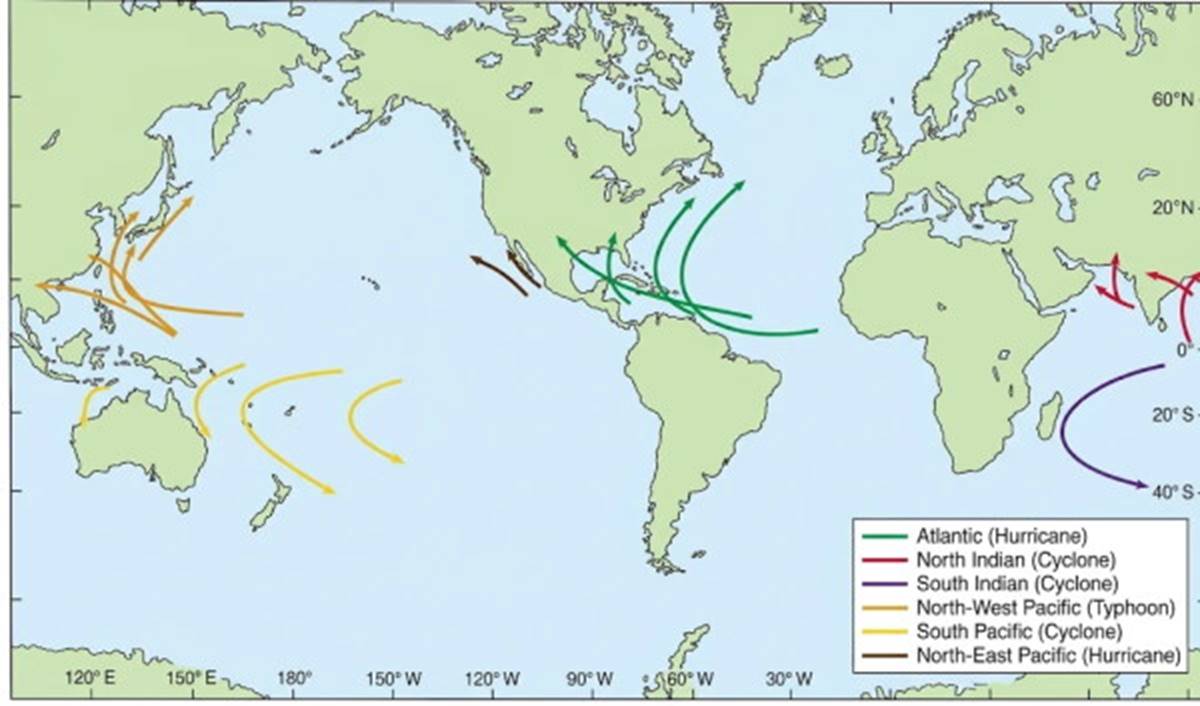
Fig. 7.21. Hurricanes, typhoons, and cyclones form on either side of the equator in tropical seas. These storms follow preferred paths in different areas of the oceans.
Forecasting and Monitoring. Forecasting the path, the strength, and the destination of hurricanes is of enormous importance to the lives and livelihoods of people around the globe. Models that incorporate satellite data, weather observations, and atmospheric data are used to make these forecasts. The relatively new geostationary operational environmental satellites (GOES) continuously monitor the position, speed, and path of these intense storms. Land-based Doppler radar can see into a hurricane as the storm approaches land and can measure its wind speed and wind distribution in great detail.
Climate Models and Hurricane Intensity. Combining these data, scientists are attempting to create other models to predict the role that global warming may play in the frequency or severity of hurricanes. Early results indicate that increasing sea-surface temperature in the Pacific Ocean could increase storm intensity. However, researchers studying the records of past storms in the Atlantic find that the frequency of intense storms is decreasing and that there are no data pointing to worsening conditions with a warmer climate. What is evident is that hurricane damage is growing because of greater population concentrations and property development in hurricane-prone areas.
El Niño and the Southern Oscillation. The complex interactions between oceanic and atmospheric systems in the Pacific Ocean produce large-scale climate anomalies known as El Niño and the Southern Oscillation, which have far-reaching global impacts.
Normal Upwelling Conditions. On the sheltered, or lee, side of the tropical landmasses of Central and South America, under the trade winds of the Pacific that blow surface water away from the shore, the upwelling of deep-oceanic water is a nearly constant process. From time to time this process falters; the trade winds strengthen, and warm tropical surface water accumulates on the western side of the Pacific. This event is followed by the trade winds' losing their driving force; the upwelling lessens, and the mass of warm western Pacific water moves eastward across the ocean to accumulate along the coast of the Americas. This sequence of events is known as El Niño, or Christ Child, named for its frequent coincidence with the Christmas season.
El Niño Characteristics. The increase in coastal surface temperatures usually ends by April, but in some years the large quantities of warm water spread north and south along the coast of the Americas, and surface temperatures remain elevated for more than a year. Years in which more severe El Niño conditions have occurred are seen in figure 7.22. During the severe El Niño of 1982–83, ocean surface temperatures off Peru rose 7°C above normal, and tropical species were displaced as far north as the Gulf of Alaska. The 1997–98 temperature rise was even greater.
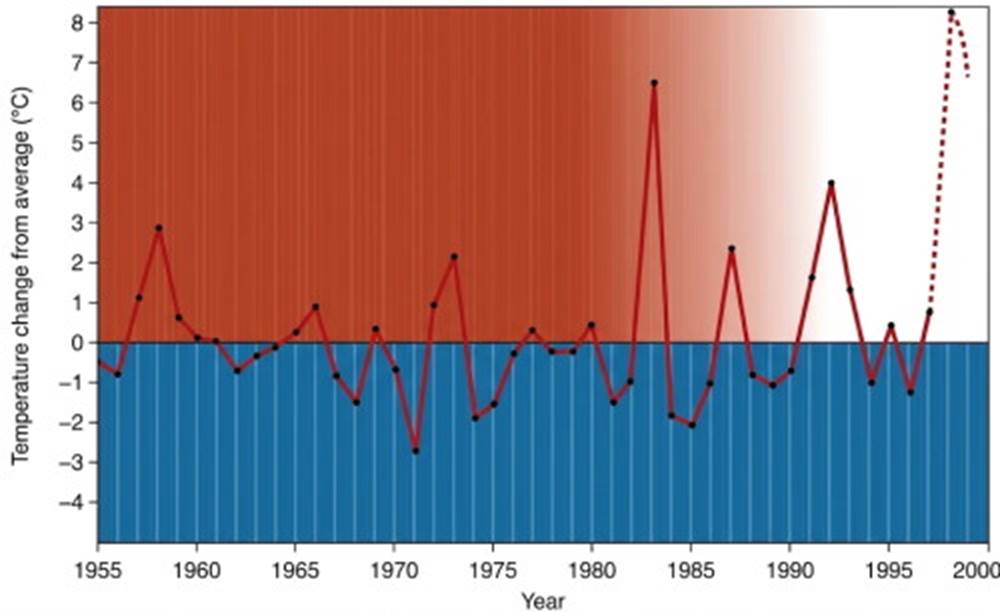
Fig. 7.22. Winter temperature changes above the 0 line indicate warmer than average El Niño events; temperature changes below the 0 line depict cooler than average La Niña events. Note the period of weak La Niña events during 1975–81 and the series of strong El Niño events since 1982. The 1955–94 sea-surface temperatures at Punta Chicama, Peru, were averaged for the months of January, February, and March; the differences between this forty-year, three-month average (18.3°C) and the yearly three-month averages are plotted in this diagram.
Global Weather Impacts. A severe El Niño event also causes displacement of atmospheric pressure cells and affects weather systems over large areas of the Earth. In 1982–83 the polar jet stream was displaced far southward over the Pacific Ocean, bringing unusually dry conditions to Hawaii and a strong low-pressure system to the Gulf of Alaska that resulted in high winds and high precipitation along the west coast of the United States. Heavy rains occurred in Ecuador, Peru, and Polynesia, while droughts came to Australia, the Sahel of Africa, southern India, and Indonesia. At the same time, lower surface temperatures in the North Atlantic made the hurricane season the quietest in over fifty years.
Specific Event Case Studies. During 1991–92 the southern displacement of the polar jet stream over the Pacific brought heavy winter rains to southern California and the U.S. Gulf Coast, and a mild, low-precipitation winter to the coastal regions of Oregon and Washington. The jet stream's extreme oscillation, north over the central United States and south over the eastern United States, gave New England and the maritime provinces of Canada extreme cold and heavy snow. The 1997–98 El Niño was accompanied by intense media coverage and the popular desire to blame any and all climate events on its presence. This El Niño began in March of 1997, and, once again, severe storms came out of the Pacific Ocean and into California, bringing higher-than-normal precipitation.
Regional Effects and Anomalies. At the same time the Pacific Northwest and Midwest winters were mild. Because El Niño tends to reduce precipitation in the wet monsoon areas of Asia, a weak rainy season was predicted, but India's rains were 2% above normal whereas Indonesia suffered prolonged drought and severe fires. South America and the southern portion of the United States experienced wetter-than-normal conditions. By the spring of 1998, Pacific Ocean sea-surface temperatures were returning to normal and signaling the end of this El Niño event.
The Southern Oscillation. One process identified with the appearance of El Niño is an increase in atmospheric pressure on one side of the Pacific and a decrease on the other, followed by a reversal of this atmospheric pressure distribution. This process is known as the Southern Oscillation. The pressure centers associated with this oscillation lie over Easter Island in the eastern Pacific and Indonesia in the western Pacific. Under normal conditions, there is a high-pressure system over Easter Island and a low-pressure system over Indonesia; the trade winds are strong and constant; and upwelling occurs along the coast of Peru.
ENSO Dynamics. When the atmospheric pressure system weakens, the southeast trade winds break down. Westerly winds are formed as a result of tropical low-pressure areas that develop over accumulated warm water near Indonesia. Over a period of two to three months, warm surface water from the western Pacific surges in a wave form across the Pacific to depress the Peruvian upwelling and raise surface temperatures (fig. 7.23). Because of the relationship between El Niño and this Southern Oscillation the two events together are known as ENSO.
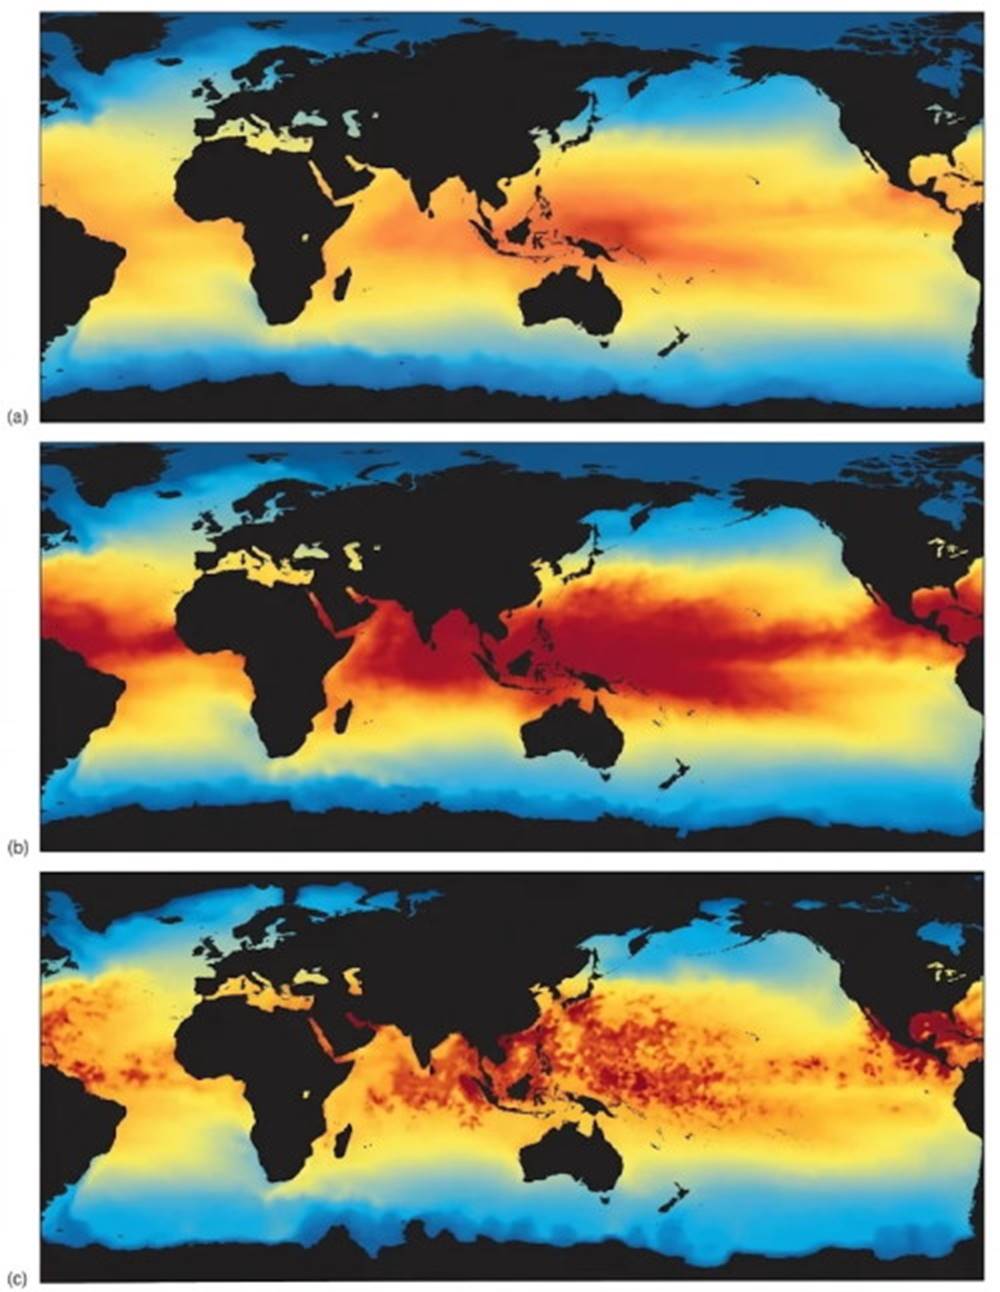
Fig. 7.23. Ocean-surface temperature data collected by satellite provide a global view of an El Niño event. Color is keyed to surface temperatures in degrees Celsius. (a) Annual mean sea-surface temperatures. (b) During an El Niño event, the pool of western Pacific warm surface water enlarges and expands across the Pacific and into the Indian Ocean. Increased sea-surface temperatures modify weather worldwide. (c) The El Niño ceases when the pool of warm surface water dissipates and heat is transported to higher latitudes.
Mechanisms of ENSO. The elevated surface temperature of the eastern tropical Pacific is due to both the intrusion of warm water and the lack of trade winds to produce upwelled water along the coast. The moving mass of warm surface water carries the overlying low-pressure zone of rising air and precipitation eastward across the Pacific. This movement causes the westerly winds to move eastward along the doldrum belt, helps the eastward movement of the warm water pool, and creates high precipitation in normally dry areas of coastal Peru.
Intertropical Convergence Zone Shifts. The southward displacement of the intertropical convergence zone, also called the doldrums, is another indication of El Niño. This movement to the south coincides with a lessening of the southeast trade winds and the development of a deep thermocline in the southwestern tropical Pacific. This southern shift occurs early in the year, when the southeast trade winds are at a minimum and the sea-surface temperatures are at a maximum. The coming of El Niño is associated with a greater-than-average southward deflection of the doldrum belt.
Duration and Termination. By midsummer, the El Niño effect lessens; in two to three months the surface water cools as upwelling is reestablished in the eastern tropical Pacific. In November and December another slight warming is often observed; the atmospheric pressure distribution in the Southern Ocean Oscillation reverses again, and the trade winds return to their normal state. A severe El Niño usually lasts about fifteen months.
Predictive Models. Computerized ENSO models attempt to forecast El Niño events by means of the Southern Oscillation sea-surface temperature and the surge in strength of the trade winds that appears to precede their decline and the development of the westerlies. In previous years observed events were not always predicted, and in some cases predictions were made of events that did not occur. Computer models successfully predicted the onset of the 1991–92 El Niño event, but the polar jet stream split over the eastern Pacific, and not all the predictions came to pass. The 1997–98 El Niño episode was predicted six months in advance, although there was difficulty distinguishing the signs of the approaching El Niño from the unusually warm conditions that have persisted throughout the 1990s.
Advanced Warning and Research. The advanced warnings of the 1997–98 El Niño are estimated to have saved $1 billion to $2 billion in property damage in the United States. Two extensive research programs have monitored sea-surface temperature in the tropical Pacific. The Coupled Ocean Atmosphere Response Experiment (COARE) continues to collect data. The Tropical Ocean Global Atmosphere (TOGA) was completed in 1994, but the drifting buoys that were set out for this experiment are still maintained and still collect data.
La Niña. Between El Niño events surface temperatures off Peru may drop below normal; an event of this type is known as La Niña, “the girl.” See figure 7.22. These colder-than-normal years also produce wide-scale meteorological effects. The trade winds strengthen and surface water temperatures of the eastern tropical Pacific are colder, whereas those to the west are warmer than normal. These changes help establish dry conditions over the coastal areas of Peru and Chile while rainfall and flooding increase in India, Myanmar, and Thailand.
Long-Term Climate Trends. The cyclic alternation between these two events has been quite regular for the last hundred years, except for the periods between 1880 and 1900, when La Niña conditions prevailed, and the 1975–97 period of El Niños. Look carefully at figure 7.22 and notice that the 0°C line represents the long-term average sea-surface temperature over the last forty or so years. If this line were redrawn between 0°C on the left and 0.5°C on the right, allowing a half-degree rise in ocean surface temperature, the cyclic alternation between El Niño and La Niña events would appear as a more regular pattern. Recent analysis of surface-water temperatures off the southern California coast during this period (1950–90) indicate an average water temperature increase of 0.8°C.
Potential Warming Mechanisms. There are at least two possible mechanisms that could lead to such a warming of ocean surface water:
1st mechanism: The ocean's response to global warming.
2nd mechanism: A reduction in upwelling in the Pacific Ocean associated with a reduction in production of North Atlantic deep water (see chapter 8).
Date added: 2026-11-09; views: 2;