Maps. Maps as Models. Types of Maps
Within all four traditions, geographers make extensive use of maps. Maps are vital to geographic communication, for the fundamental concepts of geography are easily and effectively portrayed on maps.
Maps are models. A model is an idealized abstraction from reality used as an aid to understanding reality. Along with several other types of models, maps are used extensively in geography for research and communication purposes.
Models are of four basic types: physical or analogue models, graphic models, mathematical models, and conceptual models. A physical model is a three-dimensional representation of an object. Model automobiles, rockets, and airplanes are physical or analogue models. A model airplane shows the essential components of an actual aircraft. The parts are constructed to scale, so that size and spatial relationships are preserved. Although physical models are used less frequently by geographers than the other types, geographers sometimes use globes, which represent the earth's surface in three dimensions.
A graphic model is a pictorial representation of reality. The significant features and relationships of the object under study are depicted in two dimensions. An architect's blueprint, for example, shows the design of a building and provides instructions for its construction. Maps are graphic models, as are photographs, paintings, and drawings.
A mathematical model uses equations, mathematical symbols, or logical statements to express relationships among important concepts. The relationship between latitude and temperature proposed by Aristotle represents a mathematical model. The gravity model was developed to explain the observation that flows of migration between two places increase with greater place size and decreasing distance. The gravity model suggests that the extent of migration between two places is dependent on their size and the distance between them.
A conceptual model uses combinations of words, symbols, and equations to represent geographic processes. These models are especially useful in research concerning causes and effects or complex processes. Because arrows are often drawn to show causes and effects, conceptual models are sometimes called "box-and-arrow" models.
Types of Maps. Maps are graphic models whose primary purpose is to communicate locational information. For convenience, geographers classify maps into different categories on the basis of the purpose for which they are used. The purpose of any map is to illustrate and communicate information concerning one or more of the fundamental geographical principles described earlier.
Locations on the surface of the earth are communicated through the use of location maps. Highway maps, street maps, and topographic maps are location maps. Location maps illustrate the fact that maps are models. Certain features on the surface of the earth are deemphasized or ignored while others are highlighted. Whether a feature is downplayed or given special attention depends on the purpose of the map. Since the primary purpose of road maps is to help travelers get from one place to another, these maps emphasize roads, towns, and landmarks and ignore physical features (Figure 1-13a). By contrast, topographic maps emphasize the physical features of the earth, with less attention to buildings, roads, and other cultural features (Figure 1-13b).
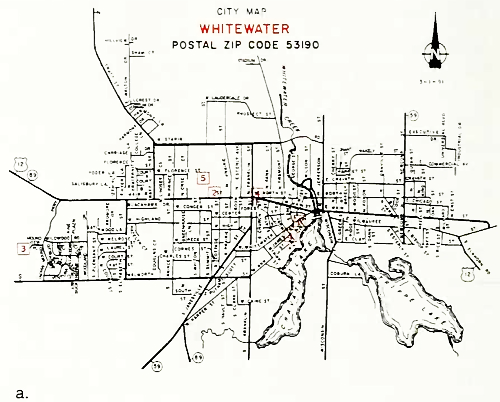
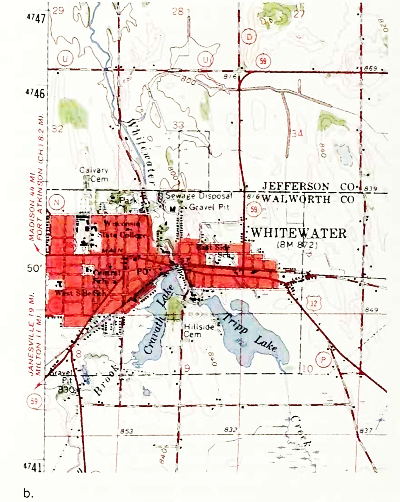
Figure 1-13. Road and Topographic Maps. Maps are models in that they abstract the most important information from a place. This is illustrated by maps of the same place drawn for different purposes. The road map (a) emphasizes roads, highways, and landmarks, while the topographic map of the same area (b) emphasizes physical features on the landscape
Other maps depict distributions and illustrate diffusion processes. These maps are grouped into the general category of thematic maps. Because geographic information can be communicated to the user in many ways, there are several important types of thematic maps. These include choropleth, isopleth. dot. and graduated-circle maps (Figure 1-14).
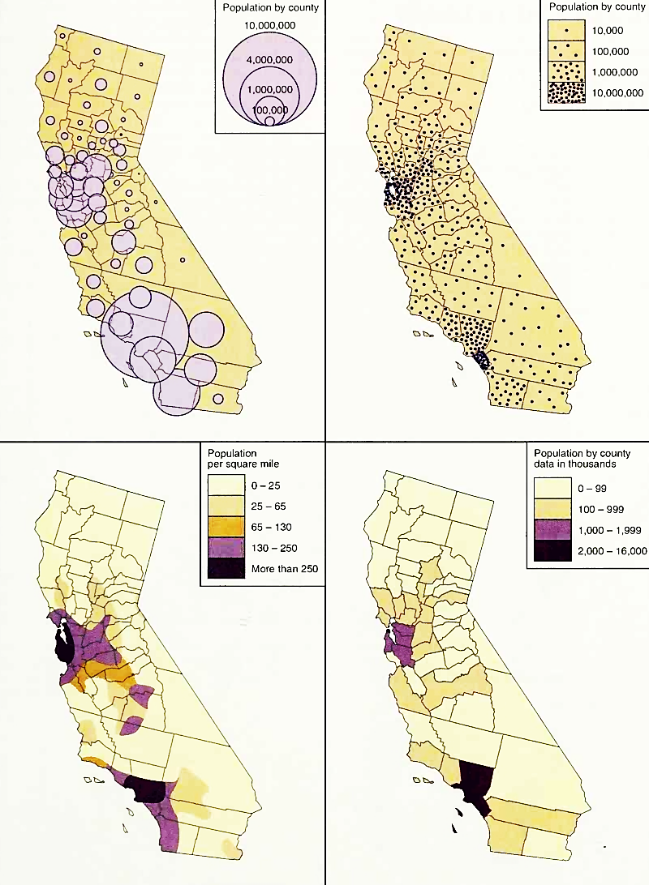
Figure 1-14. Concept Maps. Geographers use several different types of concept maps. The examples here include graduated circles (top left), dot (top right), isopleth (bottom left), and choropleth (bottom right) maps of California. Note how the different types of maps allow information about the same place to be presented in different ways. For example, population density is shown on the choropleth map, whereas the graduated-circle map is used to show absolute numbers of people
Frequently, maps show variations in statistical values by areal units such as countries, states, or counties. Once values are determined for each areal unit, the values are grouped into class intervals. The cartographer uses the same shading for each place whose value falls into a given interval. Maps of this type are known as choropleth maps. Choropleth maps are often used to depict election results, income levels, and other information on a place-by-place basis.
In other cases, lines connecting places with similar statistical values are constructed. Weather maps show places with similar temperatures or rainfall amounts in this way. This type of map is an isopleth map.
Dot maps and graduated-circle maps are useful in examining distributions. On dot maps, a single dot represents a specified number of occurrences of a phenomenon in a given area. Graduated-circle maps use circles of different sizes to represent the frequency with which a phenomenon occurs in different places. Large circles represent frequent occurrences, while smaller circles imply that the phenomenon in question occurs less often.
In examining any map, the geographer pays careful attention to scale. The scale of a map indicates the relationship between distances on the map and distances on the earth's surface. The concept of map scale is analogous to the fundamental geographic concept of scale.
Unfortunately, the spherical surface of the earth cannot be projected onto a two-dimensional flat surface without distorting fundamental spatial relationships. Distortion is minimal in large-scale maps, but it becomes a more and more serious problem with small-scale maps. Because of distortion, mapmakers must sacrifice accuracy in some spatial relationships in order to preserve it in others (Box 1-2).
The choice of which spatial relationships should be preserved and which should be sacrificed depends on the map's purpose. Accuracy in spatial relationships is important in location maps but may be less so in certain types of thematic maps. In some cases, cartographers deliberately distort spatial relationships in order to emphasize the main points communicated on the maps. The Mercator projection, for example, allows compass directions to be shown as straight lines. Other maps do not.
Date added: 2023-01-05; views: 905;