Density Relationships: Body Size and Numbers of Species and of Individuals
The so-called species abundance relationship (the number of species in different abundance classes), first explored in depth by Preston (1948), and the species body size distribution (the number of species of a particular body size in a community), popularized by Hutchinson and MacArthur (1959), are among the most prominent of general patterns in ecology. Here we focus on size relationships.
Generally speaking, there are many more species in small-to-intermediate size classes of organisms than in the larger body size classes. Even on a log scale the frequency distribution of species body sizes (species number versus log characteristic length or body mass) is typically right-skewed (Kozlowski and Gawelczyk 2002).
This generality is subject to several qualifications, among them that: (i) most of the evidence is for terrestrial, aclonal life forms; (ii) size distributions can also be symmetric or, alternatively, left-skewed; (iii) innumerable very small animals, protists, and microbes in particular remain unsampled and unidentified, implying that at least for very small organisms the plot may be artefactual; and relatedly that (iv) conventional taxonomic criteria for the smallest of organisms (prokaryotes, see below) are highly controversial and may be without real biological meaning. Within the length range of about 10 to 104 mm, the number of terrestrial animal species (S) varies roughly with characteristic length (L) by the relationship S α L-2 (May 1978). This means empirically as a general trend that for each 10-fold reduction in length a 100-fold increase in species would be
expected. However, it was argued that the relationship does not appear to hold for organisms whose body length is less than about 10 mm (species number decreases). Most evidence accumulated over the past ca. 60 years has been for terrestrial animals (Hutchinson and MacArthur 1959; Van Valen 1973; May 1978; Peters 1983; Gaston and Blackburn 2000) and plants (Aarssen et al. 2006; Dombroskie and Aarssen 2010). Peters (1983, p. 179) subsequently expressed the relationship as a function of body mass, S α W-0.67.
Bonner (1988) extended the size-frequency generality to all life forms, from bacteria to the largest macroorganisms. As shown (Fig. 4.11), his plot also depicts a reduced number of species at both ends. Based on the distinctive attributes of microorganisms, Fenchel (1993), among others (e.g., Finlay and Esteban 2007), explain species trends among the protists and prokaryotes, and distinguish between global and local (within community) dynamics. For example, Fenchel emphasizes the cosmopolitan distribution of microrgan- isms (high migration rates), their lower rates of global and local extinction, and supposed lower rates of allopatric speciation compared to larger organisms. Thus, because of very large population sizes and dispersal ability, together with prolonged quiescence capability of microbes, the dynamics of species extinction are likely quite different from macroorganisms. Indeed, it is even questionable whether the terms allopatry and sympatry as used by macroecologists have meaning in a microbial context.
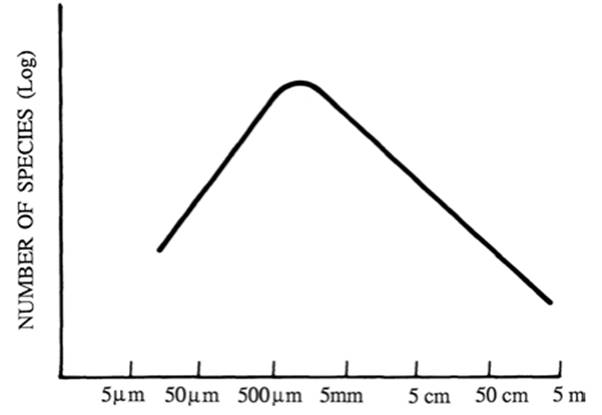
Fig. 4.11. Postulated relationship between the number of species of all organisms as a function of the typical length of the constituent individuals (log/log scale). See text for caveats. From Bonner (1988); reproduced from The Evolution of Complexity by Means of Natural Selection by John Tyler Bonner, by permission of Princeton University Press, ©1988
Fenchel’s (1993) analysis tends to discount poor taxonomic resolution as an explanation for reduced species number at the low (bacterial) end of the species size distribution. However, it is worth noting that because of the atypical sexuality of prokaryotes (reviewed in Chap. 2), the standard ‘biological species concept’ familiar to plant and animal ecologists does not apply. Bacteriologists use instead a ‘phylogenetic species concept’ whereby a species is defined operationally as a group of strains that cluster closely and distinctively from other clusters.
This somewhat arbitrary arrangement is based on physiological and, increasingly, on solely molecular criteria, e.g., sequence similarity in alignments of DNA of a phylogenetically relevant gene or multigenes. This has given rise to the term ‘operational taxonomic unit’, arbitrarily defined, as a euphemism for ‘species’. The current standard for grouping strains together as a species is 70% or greater genomic DNA-DNA hybridization, together with 97% or greater identity in 16S rRNA gene sequence (Madigan et al. 2015). A move to molecular criteria implies increasingly refined specificity in delineating new species. Will advancing taxonomic techniques and discoveries from relatively unexplored microbial habitats such as the seabed, deserts, caves, and the lithosphere alter the species size distribution for all species? In terms of total number of microbial species on Earth, a recent, extreme estimate is, remarkably, ~1 trillion (1012) (Locey and Lennon 2016a). (They include in their tally of “microbial species” bacterial, archaeal, and “microscopic” fungi; they make their projection based on scaling laws and extrapolations, among other key assumptions.) Such extrapolations are at best risky and may be invalid. Their methods have been challenged (Willis 2016) and the authors have attempted to rebut the criticism (Locey and Lennon 2016b).
The interesting biological questions are: why should there generally be more species of smaller than larger organisms? And, why does the frequency distribution appear not to hold for the smallest animal species, either overall or, for that matter, within a taxon? Multiple hypotheses have been put forward and most if not all are controversial. These began with the postulate of Hutchinson and MacArthur (1959) that smaller organisms could more finely divide a habitat than larger ones; with more such niches available, there would be more species of smaller than larger organisms. Though extrapolated to animals in general, their theoretical paper was focused on mammals. Moreover, the view of habitat complexity has expanded and become more tractable since then (e.g., Morse et al. 1985).
Nevertheless, how organisms of different sizes may see their habitat remains hotly contested (see Chap. 7). Also, a key prediction of the Hutchinson and MacArthur theoretical model, that the smallest categories of organisms either overall or within a taxon would be the most speciose, has not been realized. Rather, analysis of relationships within related assemblages (e.g., families and orders) suggests that it is not the smallest organisms that are the most species-diverse, but those averaging 38% larger than the smallest (Dial and Marzluff 1988). In other words, the small-to-medium sized taxa may be the most numerous.
They analyzed trends in 46 assemblages but excluded microorganisms. The various other explanations emphasize, for example, community dynamics (May 1978, 1988), energetic relations and fitness (Brown et al. 1993, 2004), inter- and intraspecific size optimization trade-offs (Gaston and Blackburn 2000), and the purely mathematical role of population size and size-dependent extinction and speciation processes (Stanley 1973); for general summaries see McKinney (1990), Gaston and Blackburn (2000), Kozlowski and Gawelczyk (2002), Purvis et al. (2003), Dombroskie and Aarssen 2010). Gaston et al. (1993) compare the distribution of automobile ‘species’ of different sizes with that of beetle species varying in size. They find that despite quantitative differences, the trends are the same qualitatively in the biotic and abiotic systems. This can be explained in various ways but may mean that these coincident patterns result simply from macroscale properties common to large systems in general, whether ecological, economic, or geological (see Blonder et al. 2014). Similar inanimate/animate comparisons are taken up again in Chap. 8.
In terms of number of individuals, population density tends to vary inversely with organism size. Relatively speaking, based on the wet weight of single cells, Brock (1966, p. 112) estimated that a given amount of nutrient can support 109 small bacteria, 107 yeasts, 105 amoebae, or 103 paramecia. A more contemporary estimate from actual populations in nature (a freshwater pond) shows a relative order of magnitude ranking of 1018 bacteria, 1016 protists, and 1011 small animals (reviewed in Finlay and Esteban 2007). Among macroorganisms there is also good evidence that the population density of aclonal animals decreases with increasing body size (Chap. 10 in Peters 1983). Damuth (1981; see also Carbone and Gittle- man 2002; Brown et al. 2004) expressed the relationship for mammals as follows:
Population density  (body mass)-0.75
Date added: 2025-06-15; views: 314;