Relevance of Plant-Plant Interactions for Practical Applications
The last section argued that despite the large idiosyncrasy of plant-plant interactions, some degree of generalisation is possible. In applied plant ecology, two relevant approaches follow from the overall effects of plant competition: indicator values and ecograms. To understand them, we need to briefly touch on niche concepts.
Fundamental and Realised Niches.Since Hutchinson’s (1957) famous “remarks” publication that introduced the ecological niche, ecologists have understood a niche as a set of environmental and biotic conditions under which a species is able to have a non-negative population growth rate (vulgo: is able to survive). A fundamental niche is typically wider and only limited by ecophysiological constraints (e.g. too cold or too dry). Biotic interactions (with pathogens, herbivores, competitors) reduce this niche space towards a realised niche, while mutual- ists (pollinators, nurse plants) can also increase the realised niche beyond the fundamental niche. Plants from a wide range of climates can be successfully grown in temperate botanic gardens as long as their physiological needs are satisfied. This clearly demonstrates that the realised distribution of, say, the arctic-alpine mountain avens Dryas octopetala (Rosaceae) does not reflect its fundamental niche, which would encompass at least the whole temperate zone, too.
The way competition alters the fundamental towards the realised niche was demonstrated nicely by the seminal Hohenheimer groundwater experiment (Box 19.3). It has since been repeated and confirmed for various plant communities. One important conclusion is that for many species the realised niche is much narrower than their fundamental niche, and hence it actually indicates the conditions under which a plant is growing. Only in a narrow band of environmental values, say pH between 6.5 and 7, can a specific plant be found. Thus, if we find some plant in the wild, we can be relatively certain of the pH at these sites: the plant serves as an indicator for abiotic conditions.
Indicator Values, Indicator Species and Ecograms.A plant’s niche has several abiotic dimensions: soil water content, temperature, pH, nutrient availability, light conditions and so forth. Not all of them will limit plant growth in the same way, that is, to some the plant responds more strongly than to others. As a consequence, plant occurrence may be indicative of the actual environmental value for one or two niche dimensions, but much less for a third or fourth (for more details Chap. 10).
In the 1970s, the same Heinz Ellenberg who had conducted the groundwater experiment summarised his immense field experience from vegetation recordings in Central Europe by assigning to most vascular plant species indicator values between 1 and 9 for light (L), temperature (T), continentality (K), soil moisture (F), soil pH (R), nitrogen availability (N) and, occasionally, salinity (S) (most recent version: Ellenberg et al. 1992). These values indicate the preference for an environmental condition in the presence of competitors, rather than an ecophysi- ological tolerance. To follow up on the example of Dryas octopetala, it would be characterised by the following indicator value sequence: L9 T2 K7 F4 R8 N4 S- (“-” indicates that no value has been assigned for salinity). Extreme values indicate extreme positions in the corresponding dimension, that is, here for very high light, continen- tality and pH values and very low temperature. Dryas can be grown also in moderate temperatures and high nitrogen conditions, for example, in European botanical gardens, but only after exclusion of competitors.
Given that the biotic environment changes over the range of a plant species, it is not surprising to find that these indicator values require some regional fine-tuning. The same species may be a limestone specialist in Austria but occur on high-pH schist in Norway (in the case of Dryas octopetala). Still, Ellenberg’s indicator value scheme has proven so robust, useful and pragmatic that it has been adopted in other countries (e.g. Austria, Italy, Greece, Switzerland, UK) and extended to other species groups (e.g. mosses).
Because many plant species have some value to indicate light, soil or nutrient conditions, we can move from understanding a plant’s environmental niche to its converse, using plants to indicate environmental conditions (Dufrene and Legendre 1997). Plant species whose occurrence can consistently and reliably be related to, say, soil salinity are called indicator species. Only a small subset of all plant species has a wide ecological niche in all dimensions except one, making it a reliable estimate for this one, narrow dimension. More commonly, evolutionary selective pressures have led to environmental formations, where climate and nutrient conditions co-vary (e.g. in nutrient- poor, unstable and dry sand dunes). Species adapted to these conditions indicate a formation rather than only a specific site feature. Such consistent vegetation formations are the topic of vegetation classification (Chap. 20), and here typical plant species characterise and delineate plant associations, which by themselves have indication value.
It must be pointed out that using plant occurrence (or performance) as a “bioassay” to measure environmental conditions is only a first approximation. Plants integrate environmental conditions over months and years, and dispersal limitation may lead to their absence and, hence, distort the derived value. Still, indicator values often correlate nicely with actual measurements of the environment (Ertsen et al. 1998), particularly across plots within the same vegetation type.
In a next step, we can depict the realised niches across two dimensions, for example, pH and soil moisture. This leads to so-called ecograms (Fig. 19.16), which represent niches in an idealised way, since often the actual composition is heavily modified through human management.
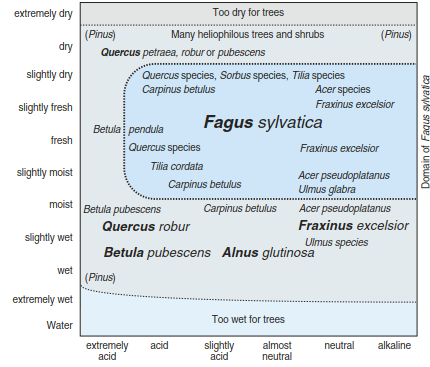
Fig. 19.16. Ecogram of submontane Central European trees showing realised niche positions along pH and soil moisture dimensions. Heavily dashed area delimits dominance region of beech Fagus sylvatica. Font size represents dominance status. (After Ellenberg and Leuschner 2010)
Ecograms can also provide a first assessment of environmental change effects, for example, of which plant species and communities we would expect when restoring drained wetlands or under greater drought stress due to climatic changes. They are necessarily incomplete, as the niche is multidimensional, but the ecogram depicts only two axes. Their added value lies in communicating our understanding to interested laypersons and to practitioners such as foresters and conservationists.
Date added: 2026-04-26; views: 165;