Various Facets of Biodiversity. Compositional Diversity
Mostly, the term biodiversity is used as a synonym for species richness, both in the media, but also still often in science. While early biodiversity research focused mainly on the number of species in an area, biodiversity is now seen as a broad concept, and it has been defined in numerous ways (Heywood and Watson 1995). In essence, it encompasses the variability of biological entities across all levels of biological hierarchies, that is, from the level of genes to ecosystems. Edward O. Wilson has simply coined it the “variety of life” (Wilson 1992).
Perhaps the most far-reaching definition is that from the UN Convention on Biological Diversity (CBD), signed at the UN Conference on Environment and Development in Rio de Janeiro 1992: “‘Biological diversity’ means the variability among living organisms from all sources including, inter alia, terrestrial, marine and other aquatic ecosystems and the ecological complexes of which they are part; this includes diversity within species, between species and of ecosystems”. This definition clearly distinguishes three basic levels of biodiversity: genetic diversity, organismic diversity and ecological diversity. These three broad groups are strongly linked to each other and share elements in common (Table 20.1).
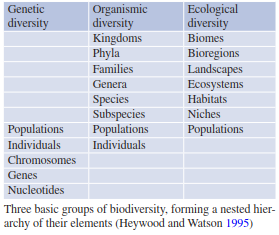
Table 20.1. Hierarchical organisation of biodiversity
Ecological diversity is sometimes further separated into community/ecosystem and landscape/regional diversity (Table 20.2). The CBD also recognises the important role of biodiversity for sustaining the life-support functions of our planet and underlies its importance for human health and quality of life.
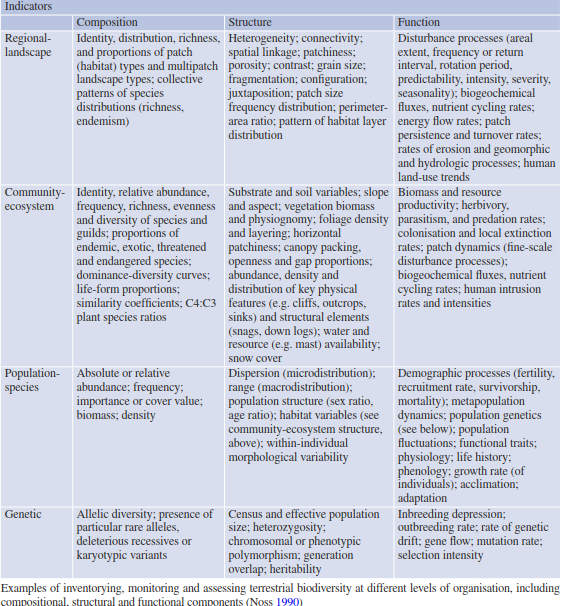
Table 20.2. Indicators and measures of biodiversity
Clearly, these broad descriptions of the term are not very helpful for more specific questions such as whether an ecosystem is functioning in different ways if biodiversity is lost. Thus, biodiversity must be defined more specifically for any given study, for example, by referring to a specific element listed in Table 20.1; these elements are hierarchically nested within each group.
In addition, biodiversity can be categorised into a second set of three different aspects: compositional, structural and functional diversity. In contrast to the aforementioned categorisation into genetic, organismal and ecological diversity that is based on the fundamental hierarchies of biological organisation, the distinction into compositional, structural and functional diversity focuses on the elements of which biodiversity is composed and the resulting physical structures and functional consequences. The biological hierarchies, ranging from the genetic to the landscape level, can also be nested within these three aspects (Fig. 20.2). A variety of indicators and tools are applicable to assess, monitor and quantify biodiversity along those three axes (Table 20.2). More recently, the diversity of interactions among organisms (e.g. competition, facilitation, pollination, herbivory) has been highlighted as a component of biodiversity that strongly influences ecological processes. For the purpose of this chapter, we will use the categorisation suggested in Fig. 20.2 because it is more closely related to the underlying mechanisms of the role of biodiversity in ecosystems. The diversity of interactions is hereby included within the functional aspects of biodiversity.
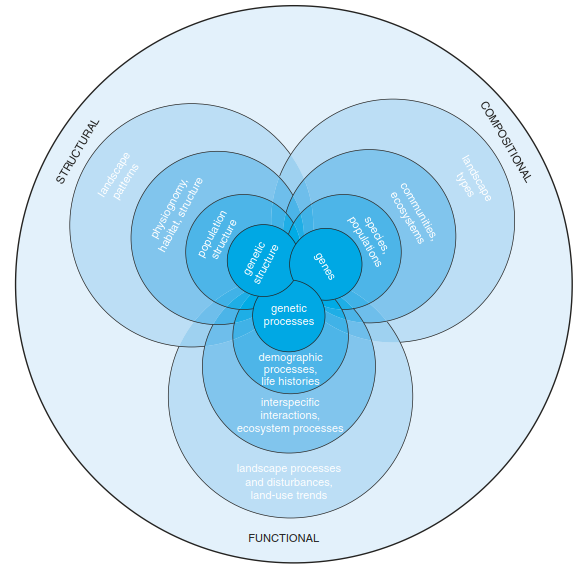
Fig. 20.2. Three spheres of biodiversity. Biodiversity can be categorised into compositional, structural and functional spheres that are interconnected. Each sphere encompasses multiple levels of organisation (Noss 1990). Reproduced with permission from John Wiley & Sons
Compositional Diversity.The number and identity of different biological entities can be used to describe the compositional diversity of ecosystems, for example, by listing how many and which plant species are growing there. Most often, compositional diversity is based on the number and variety of taxonomic units, such as species, genera or families, but it can also be based on alleles, populations, communities, ecosystems or landscape types (Fig. 20.2, Table 20.1). In biodiversity assessments and inventories the dimensionless number of species per unit of area (species richness) is often used (Fig. 20.3). More information is gained by adding abundance or dominance values (Box 20.1) and the distribution in space (e.g. spatial patterns such as clumped, regular or random distribution) (Sect. 18.2).
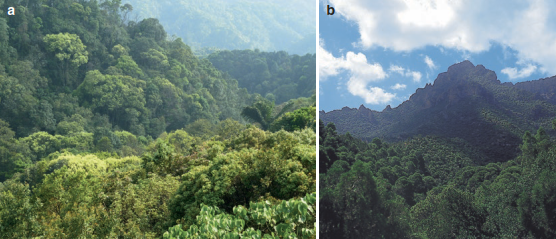
Fig. 20.3. Differences in plant species richness. Plant communities differ largely in species richness depending on environmental conditions, evolutionary history or human interference. a Species-rich natural, moist tropical forest with more than 8000 mm precipitation per year in the Bach Ma National Park in the central highlands of Vietnam, at 1000—1400 m a.s.l. b Coniferous forest in the Mediterranean region dominated by only one tree species (Pinus halepensis). In both cases, there has been little human interference in the forests. (Photos: E. Beck, K. Müller-Hohenstein)
While the number of distinct species per area or of an entire ecosystem (= species richness or species density) is by far the most frequently used metric, it should be kept in mind that biodiversity not only comprises the number of species. In fact, there is no single measure of biodiversity, and it is impossible to define the biodiversity of an ecosystem (Gaston and Spicer 1998). However, species richness has turned into a kind of “currency” in biodiversity research, because it is relatively easy to measure and because species differ in their genetic composition and functional traits, in their growth forms and stature, in their habitat requirements and biocoenotic interactions. Therefore, species diversity can also be seen as a “surrogate” for certain facets of genetic, organismal, structural, functional and ecological diversity. Species diversity and genetic diversity, for example, are sometimes well correlated, presumably because the processes determining genetic diversity should also determine species diversity. However, this covariation is mainly found in small-scale, isolated ecosystems such as oceanic islands or forest patches. In contrast, genetic diversity might be more related to demographic history in more widespread, well-connected populations where these two facets of biodiversity are less correlated (Taberlet et al. 2012).
The strong focus on species diversity calls for a proper designation of the species concept, which is not as easy as one might expect. In what follows, we will also focus on the species level to illustrate some global patterns of compositional diversity.
Estimates of the total number of all species on Earth vary greatly. Because many regions are not well sampled, we do not have a direct quantification of the global number of species. Instead, several indirect estimates have been put forth, all of which rely on particular assumptions and, therefore, have limitations. Current estimates range between three and ten million species, but the actual figure may be higher by a factor of ten. Approximately 225,000 vascular plant species have been taxonomically described, but the total number could be around 315,000.
Biodiversity cannot be described reasonably without considering spatial and temporal scales (Chaps. 17 and 18). The spatial characteristics of biodiversity are patterns of distribution of individuals, species, genera, communities and ecosystems. Recognition of these patterns depends on the scope of the research. Of course, to quantify species diversity in a cushion of epiphytic living mosses on a tree trunk in the rain forest involves different spatial scales than recording communities in a landscape where spatial patterns depend on the heterogeneity of site conditions and of human management (Fig. 20.4). The latter resulted in maximum species diversity in the traditionally managed landscapes of central Europe up to the middle of the last century, but thereafter it decreased owing to intensification of land use (Sect. 17.2).
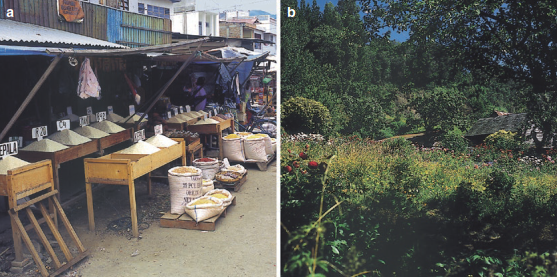
Fig. 20.4. Management and biodiversity. High species diversity is often found in traditionally cultivated landscapes, irrespective of climatic conditions. a Large number of cultivated rice varieties in a rural Indonesian market (Palu, Sulawesi). b A home garden in southern Chile (Puerto Montt). In both cultivated areas agrochemicals and modern agronomic techniques have little impact. (Photos: K. Müller-Hohenstein)
Staying at the species level, compositional diversity encompasses not only species numbers but also the frequency and abundance of different species, that is, species composition. Obviously, two plant communities may have the same species number but harbour very different species in different abundances. Such differences in species composition can be either documented in phytosociological tables (full information retained), or by visualising species abundance distributions, for example, as rank-dominance curves (moderate retention of information), or by calculating indices of similarity (easy to understand but high loss of information, for example, Jaccard or S0rensen coefficients, Box 20.1). Multivariate statistical tools can also help to visualise differences in species composition (e.g. showing the range of species composition along environmental gradients). Species composition has big consequences for the diversity of other organismic groups, such as pollinators, herbivores or pathogens, since many higher trophic groups are to varying degrees specialised for certain plant species (Sect. 19.4). In addition, species composition also has large effects on ecological processes, such as nutrient cycling, because species differ in their morphological, physiological and chemical properties or traits (Sect. 20.2.3).
Date added: 2026-04-26; views: 164;