
Climate of the Twentieth Century
The period since the mid-1800s has seen a prominent warming of Earth’s surface (Figure 8.12a). Observations show Earth’s annual global mean surface temperature increased by 0.85°C over the period spanning 1880-2012 (Hartmann et al. 2013). The warming over the last 62 years (1951-2012) was 0.72°C. The rate of warming over this period (0.12°C per decade) was twice that over the entire 133-year record (0.06°C per decade). The rate of warming was still higher over the period 1979-2012 (0.16°C per decade). Each of the past three decades (1980s, 1990s, 2000s) was warmer than the previous decades since 1850. All ten of the warmest years since 1850 occurred after 1997.
This warming was not continuous from year to year, but rather occurred in two distinct periods. Temperature was relatively stable prior to about 1915 and warmed thereafter until about 1945. Subsequent decades through the 1970s saw a small temperature decrease, with a significant warming trend thereafter. This warming is particularly prominent on land (Figure 8.12b). Land temperature increased at a rate of 0.18°C per decade over the period 1951-2012 and by 0.26°C per decade for 1979-2012 (Hartmann et al. 2013). The occurrence of cold days and nights has decreased while the occurrence of warm days and nights has increased.
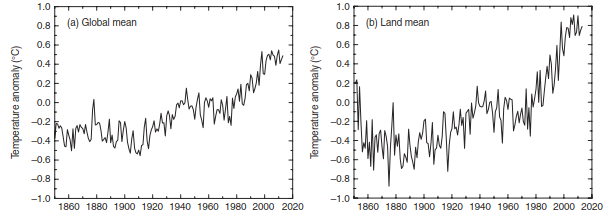
Fig. 8.12. Surface temperature for 1850-2013 based on station, ship, and buoy observations. Temperature is the anomaly from the 1961-1990 mean. (a) Annual global mean over ocean and land from the HadCRUT4 dataset (Morice et al. 2012). (b) Annual global mean air temperature over land from the CRUTEM4 dataset (Jones et al. 2012). Data provided by the Climatic Research Unit (University of East Anglia, Norwich). See Hartmann et al. (2013) for other datasets
Air temperature is not the only indicator of Earth’s changing climate (Hartmann et al. 2013; Rhein et al. 2013; Vaughan et al. 2013). Oceans have warmed, and ground temperatures have increased. The consequences of this warming are especially noticeable in the cryosphere. Spring snow cover in the Northern Hemisphere has decreased, Northern Hemisphere lakes and rivers are freezing later in autumn and thawing earlier in spring, glaciers and permafrost are melting, and Arctic sea ice is shrinking. The hydrologic cycle, too, has changed. Annual precipitation has increased in the extratropics, as has the occurrence of extreme rainfall events.
One key issue in the scientific debate is the extent to which the warming of the twentieth century reflects natural climate variability. The instrumental record dates back to the mid to late 1800s. Prior to that, tree rings, coral, ice cores, and other temperature-sensitive proxy data are used to reconstruct hemispheric and global temperature (Figure 8.5). Though such temperature reconstructions are subject to methodological uncertainties, they show that the late 1900s stands out as an exceptionally warm period with an unprecedented rate of warming (Masson-Delmotte et al. 2013).
Climate warming can be understood in terms of various radiative forcings, which constitute the changes in energy available to the climate system (Myhre et al. 2013). A positive radiative forcing means more incoming energy remains in the system, and planetary temperature increases; a negative radiative forcing means more outgoing energy, and planetary temperature decreases. Figure 8.13 shows changes in these forcings between 1750 and 2011. Increases in greenhouse gases (CO2, CH4, N2O, and halocarbons) are a positive radiative forcing that has warmed climate. The combined radiative forcing is 2.83 W m-2, of which CO2 (+112 ppm) contributes 1.82 W m-2; CH4 (+1081 ppb), 0.48 W m-2; halocarbons (chloro- fluorocarbons, hydrochlorofluorocarbons, and chlorocarbons), 0.36 W m-2; and N2O (+54 ppb), 0.17 W m-2. Ozone is another important greenhouse gas. Increasing amounts of ozone in the troposphere is a positive radiative forcing (0.40 W m-2) while ozone depletion in the stratosphere is a small negative forcing (-0.05 W m-2). Human activities have increased stratospheric water vapor, because chemical destruction of anthropogenic CH4 in the stratosphere produces a small amount of water vapor. This provides a positive radiative forcing (0.07 W m-2).
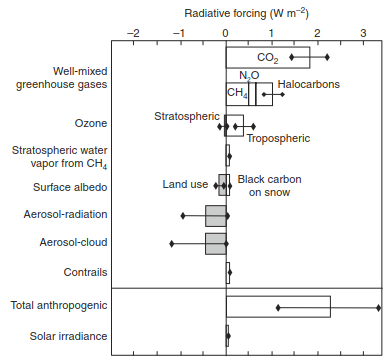
Fig. 8.13. Change in global mean radiative forcing between 1750 and 2011. Anthropogenic forcings are greenhouse gases, ozone, water vapor, surface albedo, aerosols, and contrails. Solar irradiance is a natural forcing that increased during this period. this is compared with the net anthropogenic forcing. Bars indicate uncertainty estimates. adapted from myhre et al. (2013)
| Fig. 8.13 |
| Radiative forcing (W m 2) -2-10 1 2 3 |
| CO2 ♦- |
| Stratospheric |
| NO |
| Halocarbons |
| CH |
Aerosols affect climate by absorbing and scattering radiation (aerosol-radiation interactions) and by altering cloud albedo (aerosol-cloud interactions). Both produce a negative radiative forcing. The net aerosol-radiation interactions forcing from sulfate aerosols, fossil fuel organic and black carbon aerosols, biomass burning aerosols, secondary organic aerosols, nitrate aerosols, and mineral dust is a negative radiative forcing (-0.45 W m-2), primarily from sulfate aerosols, though black carbon emitted during combustion of fossil fuel absorbs solar radiation and is a significant positive radiative forcing. The aerosol-cloud interactions forcing is comparable (-0.45 W m-2). Additionally, aerosols deposited onto snow and ice decrease surface albedo, which provides a small positive radiative forcing (0.04 W m-2). Clearing of land for agriculture has increased surface albedo over large regions of the world. This is a negative radiative forcing (-0.15 W m-2). Contrails in the atmosphere produce a small positive radiative forcing (0.06 W m-2).
The net anthropogenic radiative forcing between 1750 and 2011 is 2.3 W m-2. In contrast, the natural radiative forcing from volcanoes and solar variability is about 2% of this value. Emission of volcanic aerosols, while important, is episodic, and sulfate aerosols from SO2 are relatively short lived (less than one year). Solar irradiance has produced a small positive radiative forcing (0.05 W m-2). The preponderance of evidence shows that the net anthropogenic radiative forcing is positive and vastly exceeds that from natural processes. It is highly unlikely that natural processes have had a warming influence comparable to that of the net anthropogenic radiative forcing.
The transient response of climate to changes in external forcings is a complex outcome of physical, chemical, and biological feedbacks within the Earth system that amplify or dampen the response to forcings (Figure 8.14). For example, water vapor, clouds, surface albedo, and ocean processes provide strong positive and negative physical feedbacks in response to warming. Other processes such as soil moisture, the greening or dieback of vegetation, the carbon cycle, and the cycling of nitrogen relate to ecosystems and their responses to climate change. Natural climate variability internal to the system modulates the system response to these feedbacks. The El Nino/Southern Oscillation, North Atlantic Oscillation, and other modes of variability create internally generated fluctuations in temperature and precipitation superimposed on the long-term response to forcings. The realized outcome is the response to the imposed forcings, feedbacks, and internal variability.
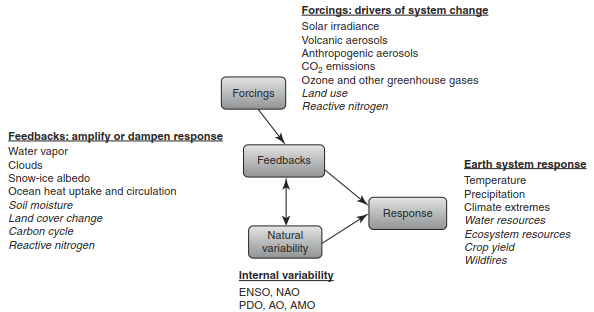
Fig. 8.14. Depiction of climate response to forcings as modulated by physical, chemical, and biological feedbacks within the system and natural variability internal to the system. Ecological processes are highlighted in italics
Global climate models are used to attribute temperature trends over the twentieth century to particular forcings, and to study how climate might change in the future with altered forcings. These models of the atmosphere-ocean-land-sea ice system simulate the climate of the preindustrial era, often taken as the mid-1800s (e.g., 1850), given appropriate forcings for that era. A long, multi-century simulation provides an estimate of climate in the absence of temporal trends in forcings. Then, the models simulate the time evolving climate through the twentieth century (e.g., 1850-2005) with prescribed concentrations of greenhouse gases and other forcings. Particular natural and anthropogenic forcings are included or excluded to test which forcings produce the best match between simulated and observed temperature trends over the twentieth century.
Climate models focus on physical processes coupling the atmosphere-ocean-land-sea ice system. In contrast, Earth system models represent the physics, chemistry, and biology of the Earth system and include atmospheric chemistry and terrestrial and marine ecology and biogeochemistry. A prominent use of Earth system models is to simulate the global carbon cycle and its feedback with climate change. While climate model simulations are driven by prescribed CO2 concentrations, Earth system models are driven by anthropogenic CO2 emissions and simulate atmosphere CO2 as the balance among emissions and terrestrial and marine ecosystems processes.
Model simulations that include only natural forcings (solar irradiance, volcanic aerosols) do not reproduce the warming in the latter half of the twentieth century while models that also include anthropogenic forcings (greenhouse gases, aerosols, ozone, land-use change) do simulate the warming (Bindoff et al. 2013). Figure 8.15 shows results from such simulations for one climate model (Meehl et al. 2004). The model replicates the early twentieth century warming with natural forcings (chiefly solar irradiance), but reproduces the late twentieth century warming only when anthropogenic forcings (primarily greenhouse gases) are included. That the observed warming of the twentieth century is only simulated when anthropogenic forcings are included suggests an influence of humans on climate. However, not all anthropogenic emissions warm climate. Sulfate aerosol particles produced by industrial activities have lowered global temperature and have decreased the temperature warming below that expected from higher greenhouse gas concentrations alone.
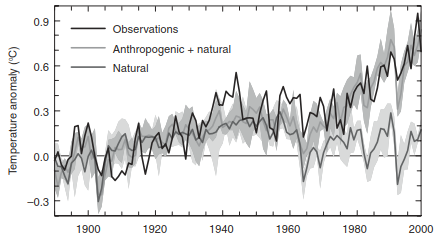
Fig. 8.15. Transient climate model simulations of the twentieth century with only natural forcings (solar irradiance, volcanic aerosols) and with natural and anthropogenic forcings (greenhouse gases, sulfate aerosols, ozone). Observed and simulated annual global mean surface air temperature is the anomaly from the 1890-1919 mean. Simulations were performed four times for each forcing. Shown are the means for each 4-member ensemble (solid line) and the ensemble range (shading). Adapted from Meehl et al. (2004). See color plate section
Figure 8.15 illustrates the three key components of climate change simulations: forcings (perturbations to the system); model response (also called the forced response); and natural climate variability (the unforced variability internal to the system). Each of these produces uncertainty in the simulations. The importance of natural variability is assessed through a multi-member ensemble of simulations with a single model. Because of the chaotic and nonlinear nature of climate, small differences in initial conditions produce different climate trajectories, each of which is an equally plausible realization of climate. This is seen in the ensemble spread for the two forcing simulations. Various models differ in their forced response, due to their spatial resolution, parameterization of processes, and other factors. While Figure 8.15 shows results for a single model, climate change assessment is typically given in terms of multi-model ensembles. Uncertainty in the forcing occurs because direct observations are not available to reconstruct the various forcing agents.
Climate model simulations can be used to partition the temperature increase to particular forcings. Earth’s annual global mean surface temperature increased by about 0.65°C over the period 1951-2010, and multi-model simulations show that most of this warming came from greenhouse gases (Bindoff et al. 2013). The models attribute 0.5-1.3°C (midpoint, 0.9°C) of the temperature increase to greenhouse gases. Other anthropogenic forcings (aerosols, ozone, land-use change) contributed between -0.6°C and 0.1°C (midpoint, -0.25°C). The net anthropogenic effect was a warming of 0.6-0.8°C, consistent with the observed warming over this period. Natural forcings had a minor effect on temperature (-0.1 to 0.1°C), as did internal variability (-0.1 to 0.1°C).
Date added: 2026-09-24; views: 2;