
Climate of the Twenty-First Century
Climate models simulate climate change for the twenty-first century using greenhouse gas concentrations and other forcings derived from representative concentration pathways (RCPs). These depict four different scenarios of the future with respect to population growth, socioeconomic change, technological change, energy consumption, and land use; resulting emissions of greenhouse gases, reactive gases, and aerosol precursors; and the concentration of atmosphere constituents (Table 2.3, Figure 2.11). They span a range of radiative forcing values at year 2100, with a high emission scenario (8.5 W m-2, RCP8.5), two medium stabilization scenarios (4.5 W m-2, RCP4.5; 6.0 W m-2, RCP6.0), and one mitigation scenario with low radiative forcing (2.6 W m-2, RCP2.6).
Figure 8.16a shows a multi-model synthesis of climate simulations through 2050 for the four RCPs using 25-42 models depending on scenario (Kirtman et al. 2013). The spread across models and RCPs is about 0.5°C and increases over time. Over the near-term (2016-2035), the increase in annual global mean surface air temperature is simulated to be 0.3-0.7°C relative to the 1986-2005 reference period. Over this time period, the spread across the four RCPs is small (0.2°C) relative to the spread among models (0.4°C).
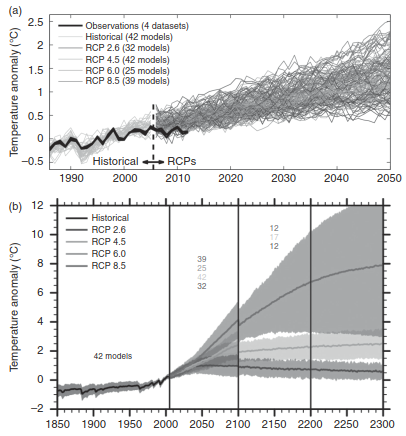
Fig. 8.16. Transient climate model simulations for the historical era and with the four representative concentration pathways (RCPs). Shown are the annual global mean surface air temperature anomalies (relative to 1986-2005) for the historical period (prior to 2005) and for the RCPs. Only one ensemble member was used from each model, and numbers in the figure indicate the number of models contributing to the different time periods.
(a) Near-term climate change for 1986-2050. Each individual line is a single model realization for the historical period and the RCPs. The thick black line denotes observed temperature based on four datasets. Adapted from Kirtman et al. (2013).
(b) The full simulations for the historical period (1850-2005) and the RCPs (2005-2300). Solid lines show the multi-model mean and the shading denotes the spread among the individual models. The discontinuity at 2100 for RCP8.5 is an artifact of the model sample size. Adapted from Collins et al. (2013). See color plate section
| (a) |
The long-term warming is larger (Collins et al. 2013). Figure 8.16b shows a multi-model synthesis of climate simulations through 2100 and extended for an additional 200 years until 2300, and Table 8.1 summarizes results. Annual global mean surface air temperature increases during the twenty-first century for all scenarios, and the warming directly relates to the magnitude of the radiative forcing. The low radiative forcing scenario (RCP2.6) has a warming of 1.0°C at mid-century and 1.0°C at the end of the century. The stabilization scenario (RCP4.5) has a warming of 1.4°C at mid-century and 1.8°C at the end of the century. RCP6.0 has still larger warming (1.3°C and 2.2°C, respectively). The largest warming is with RCP8.5, where temperature increases by 2.0°C at mid-century and 3.7°C at the end of the century. Warming continues unabated in the business-as-usual scenario with high radiative forcing (RCP8.5).
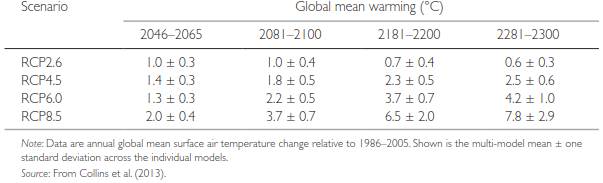
Table 8.1. Multi-model ensemble mean global temperature change for the middle and late twenty-first century and the late twenty-second and twenty-third centuries in the four representative concentration pathways
Even if concentrations are stabilized without further increases, climate will continue to warm for hundreds of years (Collins et al. 2013). Past anthropogenic emissions commit us to long-term warming because of the large thermal reservoir of the ocean and the slow mixing of the radiative forcing energy perturbation into the ocean. This climate change commitment is seen in the simulation with RCP4.5 extended through 2300. In this scenario, atmospheric CO2 and radiative forcing stabilize before 2100. However, the warming continues through 2300 (Figure 8.16b). Global temperature at the end of the simulation (averaged for the period 2281-2300) is 0.7°C warmer than that of the period 200 years earlier, at the end of the twenty-first century (Table 8.1).
The atmospheric CO2 concentration at a given point in time depends on the total amount of anthropogenic CO2 released in the atmosphere (the cumulative carbon emission), the resulting climate change, and feedbacks that alter the accumulation of anthropogenic emissions by the terrestrial biosphere and oceans. Despite these complexities, cumulative total anthropogenic CO2 emissions and the change in global mean surface temperature are approximately linearly related (Allen et al. 2009; Matthews et al. 2009, 2012; Collins et al. 2013). The exact relationship is model dependent, but each model shows a near linear relationship between temperature change and cumulative emissions, independent of the exact emissions scenario. Figure 8.17 shows this relationship as the multi-model mean of many different climate simulations over the period 1870-2100. If the warming caused by anthropogenic CO2 emissions is to be limited to less than 2°C (relative to the period 1861-1880), cumulative emissions from all anthropogenic sources must be less than 1000 Pg C since that period (Collins et al. 2013). About one-half of that carbon has already been emitted by 2011. This illustrates the difficulty of achieving climate targets as CO2 mitigation is delayed (Stocker 2013).
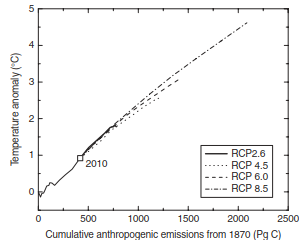
Fig. 8.17. Annual global mean surface air temperature increase in relation to cumulative anthropogenic CO2 emissions. Temperature is the anomaly relative to 1861-1880. Shown is the multi-model mean for the historical period (until 2010) and each of the four RCPs until 2100. Each line is a temporal trajectory of the temperature anomaly at a given period in relation to the cumulative emissions to that period. Adapted from IPCC (2013)
Uncertainty in climate change projections arises from the forcings (scenarios), the model response, and internal (natural) variability (Hawkins and Sutton 2009; Meehl et al. 2009). Forcing uncertainty is assessed through different emission scenarios (i.e., the four RCPs). Model response uncertainty is assessed through multi-model ensembles. Natural variability is assessed through a multi-member ensemble of simulations for each model. For temperature projections at near-term decadal timescales (10-30 years), the particulars of the forcing (i.e., scenario uncertainty) are less important than model response uncertainty and internal variability (Figure 8.18). Scenario uncertainty is important at multi-decadal lead times.
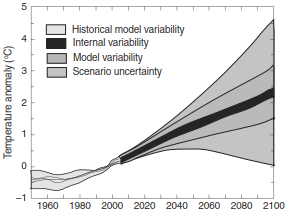
Fig. 8.18. Sources of uncertainty in climate simulations through 2100. Shown is the annual global mean surface air temperature anomaly (relative to 1986-2005). The shading denotes uncertainty from internal variability, model variability, and scenario variability. Also shown are model variability over the historical period (1850-2005) and three datasets of global mean temperature (solid lines). Adapted from Kirtman et al. (2013)
Distinguishing between the internally generated climate variations (i.e., natural variability) and the anthropogenically forced climate change is a key requirement in climate change detection and attribution analyses (Deser et al. 2012; Hawkins and Sutton 2012; Mahlstein et al. 2012). Natural variability manifests as interannual-to-decadal climate variability, seen in observations and an individual model realization, as well as ensemble variability within a model. Climate change detection and attribution requires determining the time when the signal of the forced temperature change becomes large relative to its natural variability. The time at which the forced climate change signal emerges from the noise of natural climate variability is known as the time of emergence. The time of emergence is defined as the year at which the forced climate change signal (S, e.g., change in annual temperature) exceeds the noise (N, e.g., standard deviation of annual temperature) by a particular threshold (e.g., S / N >1 or >2). The time of emergence for temperature can range from a few decades in the mid-latitudes to several decades in regions with high natural variability.
Date added: 2026-09-24; views: 2;