Global Plant Diversity Patterns and Climate Drivers
Barthlott et al. (2005) presented a detailed world map of phytodiversity (of vascular plants) that shows the large spatial gradients in plant species richness on a global scale. Such maps can be produced by overlying information about the spatial distribution of single species, which is derived from herbarium records, taxon revisions or range maps. An alternative to such a taxon-based approach is the inventory-based approach where species richness values from thousands of floras, local checklists and regional species accounts are used to calculate species richness at a specific spatial grid resolution. Since the sampled areas differ in size, the richness values for this spatial pixel have to be standardised using an empirical species-area relationship (Sect. 18.4).
Finally, non-sampled areas are interpolated using data on climate, vegetation types and geodiversity. In the map shown here (Fig. 20.11a), which uses a 100 x 100 km grid, 10 diversity zones are graded according to the number of species, from fewer than 100 to more than 5,000 per grid cell. The zones of lowest plant diversity are located in the Arctic tundra, the driest deserts (e.g. parts of the Sahara) and high alpine deserts (e.g. Tibetan upland). These regions are characterised by a lack of available ambient energy or humidity, limiting plant growth. An exception to this rule is the Namib Desert in southern Africa, which has a very long evolutionary history, high heterogeneity in topography and soils, and highly predictable rainfalls from fog in winter.
The centres of highest phytodiversity are located in the humid tropics, including the Tropical East Andes, North Borneo and New Guinea, but also on the Atlantic coast of Brazil. Interestingly, not all tropical regions outnumber non-tropical ones: for instance, plant species richness in the Congo basin, where large areas are still rather undisturbed by humans, is comparable to that in Central European regions, which have been under long-term human influence. Other extra-tropical regions of high diversity are located at the Maritime Alps in France, the Caucasus or the Cape of South Africa.
Are these patterns similar for different plant life forms? Trees, being important structural components of forest ecosystems and delivering many ecosystem goods and services, such as timber and non-timber products, are relatively well known in terms of their taxonomy and distribution. In addition, the increasing number of permanent forest inventory plots also allows for an upscaling of tree species richness to continental scales, assuming a relation between the number of species and the number of individuals of a defined region. Using standardised species lists with abundance data in such inventory plots in wet, moist and dry tropical forests, a recent study could show that the number of tropical tree species ranges between 40,000 and 53,000 in total, in contrast to only 124 tree species in temperate Europe (Slik et al. 2015)! The Neotropics and the Indo-Pacific region have very similar tree species richness (between approx. 18,600 and 24,800 species), while tropical forests of Africa are rather species poor, with only between 4,600 and 6.0 species. Thus, at least tropical trees indeed show spatial patterns similar to those shown for all vascular plants (Fig. 20.11).
So what factors are responsible for these spatial patterns? Kleidon and Mooney (2000) compared the map by Barthlott et al. (2005) with a map in which the global diversity of vascular plants was reconstructed on the basis of a climate model. Despite the different resolutions, both maps agree to a large extent (Fig. 20.11b). Obviously, climatic conditions can explain biodiversity at the global scale to a substantial degree. Climatic factors mostly constrain plant survival at the time of germination and during the development of young plants, and sufficient precipitation during those stages appears as a decisive factor: the smaller the number of days with favourable conditions for plant growth, the greater the constraints for growth and the less the diversity of species.
Also, at higher taxonomic levels, climatic factors are well correlated with diversity. Woodward (1987) found a linear relation between the number of plant families and the absolute minimum temperature (for land surfaces along a 15°N latitude). In absolutely frost-free areas, the number of plant families exceeds 250; below a minimum of 10 °C, the number is less than 100. Another, well-known example of changes in plant diversity along environmental gradients relates to the geographical distribution of tree species in North America. As shown in Fig. 20.12a, the number of tree species correlates rather negatively with increasing latitude, that is, fewer tree species are found towards the boreal zone. Climatic factors, such as mean annual temperature, annual solar radiation and precipitation, as well as actual evapotranspiration (Sects. 10.1 and 16.1), are positively related to tree species richness. Evapotranspiration is also strongly related to species richness of all vascular plants of North America (Fig. 20.12b). At lower latitudes between 30° and 40°N, the higher variability is also due to climatic factors: precipitation and, thus, water availability strongly decrease from east to west in this region.
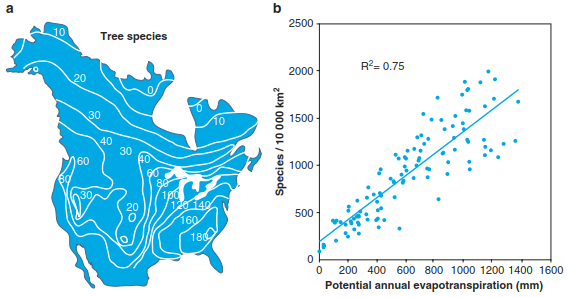
Fig. 20.12. Patterns of plant diversity along latitudinal and climatic gradients. A geographical distribution of tree species in North America. The isolines connect points with rather similar species numbers (Currie 1991). Reproduced with permission from University of Chicago Press. b Species diversity correlates well with climatic factors, such as evapotranspiration, that change along the latitudinal gradient, as shown for all vascular plant species of North America. The number of vascular plant species is based on grid cells of 100 × 100 km. Modified from Mutke and Barthlott (2005). Reproduced with permission from The Royal Danish Academy
But is climate indeed the only driver of global, large-scale patterns in plant diversity? What other factors might also play a role? Such questions fall within the purview of macro-ecology. Several, not mutually exclusive, hypotheses have been formulated to explain the high plant diversity in the tropics and the decrease of diversity towards higher latitudes (see overviews by, for example, Huston 1994; Rosenzweig 1995; Hillebrand 2004; Clarke and Gaston 2006). Due to lower climatic fluctuations during the ice ages in the inner tropics, long-lasting favourable climatic conditions enabled long and undisturbed adaptation and specialisation.
This can be illustrated by looking at the tree diversity data: as shown earlier, Africa harbours only approx. one-fourth of the diversity found in North America or the Indo-Pacific region, which cannot be explained solely by its smaller size and lower environmental variability. Rather, African forests were shrinking to small refugia areas during the Pleistocene, resulting in large species losses. Expanding to the current area, these forests must be repopulated from a depleted species pool, while forest area in the other two regions has not experienced similar shrinkages (Slik et al. 2015). Similarly, geologically old regions of the Earth are generally particularly rich in species because of their long history of evolution compared to geologically younger parts. Higher solar radiation and higher soil water availability at the equator, leading to increased evapotranspi- ration, result in increased annual productivity, which is the basis for many other organisms that can exploit this resource. A comparison between global maps of net primary production (Sect. 21.2, Fig. 21.4) with that of plant diversity (Fig. 20.11) intuitively shows that there might be underlying factors that positively influence both productivity and diversity. This climate-driven “energy-diversity hypothesis” has attracted substantial interest and is now considered one of the most important drivers of those latitudinal gradients (Fig. 20.12).
In addition, higher predation and pathogen load all year round in tropical regions can reduce the dominance of single species, enabling the coexistence of other species with lower abundance. Finally, the tropical regions also have a higher land-to-sea ratio than regions at high latitudes, so that terrestrial diversity should be higher based on the species-area relationship (Sect. 18.4). In contrast, climatic regions requiring specialised adaptation by organisms to harsh conditions, such as boreal forest or tundra biomes, are often relatively poor in plant species owing to strong environmental filtering (Sect. 20.3.4). For the same reasons, the number of plant species generally declines with altitude in high mountains, although the diversity in mountainous areas is higher than in lowlands if based on the available area for plant growth (Korner 2003). This has been explained by their geographical isolation and the high degree of topographic complexity and strong climatic gradients, leading to a high number of small-scale structures (habitats) in a given space, which allows many specialised species to coexist. In addition, lower human impacts and low- intensity management regimes may have led to high levels of biodiversity in mountainous areas.
Date added: 2026-04-26; views: 156;